Most ecommerce ROAS plans start with creative.
That is the wrong order. Creative refresh wastes itself on broken tracking and weak feeds. Get the foundation right and ROAS compounds.
This is the YARD playbook for ecommerce roas optimization. We ran it on nine D2C brands. The anchor case: a US luxury D2C brand in Hawaii. ROAS moved from 2x to 10.6x. BFCM peaked at 32x.
Quick Facts: The YARD ecommerce ROAS playbook
- a US luxury D2C brand: ROAS 2x to 10.6x in 10 months.
- BFCM peak: 32x ROAS in a single week.
- BFCM week revenue: $122K from 123 orders on $2,498 spend.
- Total ad revenue Mar-Dec 2025: $400K on $37,871 spend.
- Andromeda rewards creative diversity. We ship 14-15 fresh assets a week. (Source: Meta for Business, 2024 — meta.com).
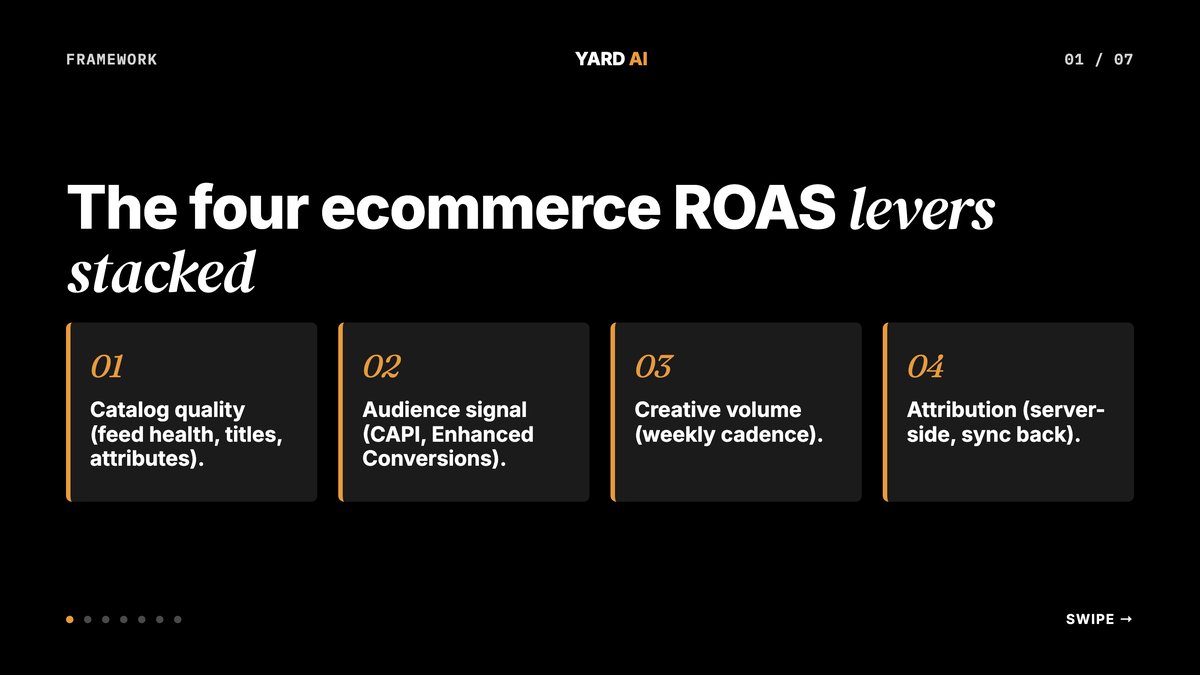
The 4 ROAS Levers Every D2C Brand Must Pull
There is no single ROAS lever. There is a stack.
Four levers compound. Skip one and the others stall. Pull them in order. The order matters because each layer feeds the next.
The four levers:
- Catalog quality. Feed health, product titles, attributes.
- Audience signal. Server-side tracking, CAPI, Enhanced Conversions.
- Creative volume. Weekly cadence, format mix, hook diversity.
- Attribution. Clean data sent back to Meta and Google.
Most teams skip the first two. They jump straight to creative. New ads run on a broken feed and weak signal. Money burns. ROAS does not move.
We see this pattern on every audit. The fix is boring. Rebuild the foundation first.
According to Adobe, US online holiday spend hit $241B in 2024. Cyber Week alone drove $40.6B. ROAS pressure rises every year. (Source: Adobe Digital Economy Index, 2024 — business.adobe.com)
The cost per click rose with it. Brands that hold ROAS now do one thing well. They run all four levers in parallel, not in silos.
Q: Which lever moves ROAS first?
A: Catalog quality. Most brands ship default supplier titles. A title rewrite alone can lift Shopping ROAS by 20-40% inside two weeks. We see this on every audit.
Each lever has its own pace. Catalog moves in days. Signal moves in weeks. Creative is a drumbeat. Attribution compounds month over month.
Run all four together. Skipping any one leaves money on the table.
Actions for this section:
- Audit your feed health score this week.
- Map each ad account to one of the four levers.
- Pick the weakest lever and start there.
Merchant Center Optimization: Your First Quick Win
Merchant Center Optimization is the most undervalued ROAS lever. It is also the cheapest.
Google Shopping matches queries to your product titles. Default supplier titles lead with brand. Most shoppers do not search by brand.
The fix is simple. Rewrite titles to match search phrasing. Then watch Shopping ROAS lift.
The YARD title format:
- Lead with category and product type.
- Add the most-searched attribute next (size, color, feature).
- End with brand if at all.
Examples of the rewrite:
- Bad: "Lifestyle Sneaker SS24".
- Good: "Barefoot Running Shoes for Wide Feet — Wide-Toe Trainer Pro".
- Bad: "SKU-2024-DSK-001".
- Good: "Premium Hardwood Desk Organizer — [Brand]".
Research shows Google Shopping rewards keyword-rich titles. Google's own docs flag title quality as a top feed factor. (Source: Google Merchant Center Help, 2024 — support.google.com)
Beyond titles, the feed has more wins. Image quality matters. So do GTINs and brand fields. Custom labels let you segment SKUs by margin or velocity.
We ran this across multiple D2C e-commerce accounts. Every account saw a Shopping ROAS lift inside the first month.
For a US luxury D2C brand the lift was the start of the climb. Titles drove search match. Search match drove clicks. Clicks drove conversions. ROAS moved from 2x to 10.6x over 10 months.
The full Foundation phase had three parts. Merchant Center rebuild. Enhanced Conversions on every event. CRO sticky ATC plus collection-page redirects.
Q: Why does title rewriting beat bidding tweaks?
A: Bidding optimizes for the queries you already match. Titles change which queries you match at all. New matches mean new revenue, not just cheaper clicks.

Actions for this section:
- Export your top 50 SKUs from Merchant Center.
- Rewrite titles in the YARD format.
- Re-upload and watch Shopping ROAS for 14 days.
The Dual-Funnel Meta Architecture
The Dual-Funnel Meta Architecture is how we scale paid social. It is two campaigns, not ten.
a footwear brand in the UAE used this exact setup. Revenue went 4x. CAC dropped 52%. The pattern held for 12 months.
a footwear brand ran the same playbook. Revenue went 7.4x. CAC dropped 50% in six months. We adapted the funnel for multi-brand and condition-based targeting.
The two campaigns:
- Campaign 1: Add-to-Cart objective. Broad targeting. Top-funnel discovery.
- Campaign 2: Advantage Shopping for Sales. Catalog plus Advantage+ creative. Broad targeting.
- Optional: Retargeting for last-30-day engagers.
The split matters. Campaign 1 finds new buyers. Campaign 2 closes them with the catalog. Each campaign trains on its own signal.
Old Meta playbooks broke audiences into ten cohorts. Lookalikes, interest stacks, custom segments. Andromeda hates that now.
According to Meta, Andromeda is the new ad ranking model. It rewards creative diversity and broad targeting. Tight audiences hurt now. (Source: Meta for Business blog, 2024 — meta.com)
The fix is to give the algo room. Broad targeting plus volume of creative beats narrow audiences plus thin creative. Every time.
Q: Why only two main campaigns on Meta?
A: Andromeda needs scale and signal. Two broad campaigns give the algo room. Ten narrow ones starve it. a footwear brand proved the pattern at 4x revenue.
For a footwear brand we layered condition-based hooks. Flat feet. Arch support. Plantar care. Each hook ran inside the same two campaigns. The algo sorted the rest.

Actions for this section:
- Consolidate Meta down to two main campaigns.
- Set both to broad targeting with Advantage+ creative on.
- Cap retargeting at 30-day engagers only.
The 6-Campaign Google Ads Architecture
Google needs the opposite of Meta. Six campaigns, each with one job.
The 6-Campaign Google Ads Architecture covers every intent layer. Brand, generic, competition, two PMax buckets, and Demand Gen.
The six campaigns:
- Brand Search. Exact match only.
- Generic Search. Phrase match.
- Competition Search. Exact plus phrase.
- Category PMax. One asset group per category.
- Product PMax. SKU-level granularity.
- Demand Gen. YouTube and Discover for top-funnel.
Each campaign has one job. Brand defends your search shelf. Generic captures category intent. Competition steals share. Category PMax scales hero collections. Product PMax pushes long-tail SKUs. Demand Gen seeds top-funnel.
The mistake most teams make is mixing intents. They run brand and generic in one campaign. They lump category and product PMax. The algo cannot allocate budget well.
This is what powered a US luxury D2C brand from 2x to 10.6x ROAS. We rebuilt Google around six clean buckets. Then we plugged in segmented PMax with strong feed data.
The Google Architecture phase came right after Foundation. Brand Search ran first. Then Product Shopping with rebuilt titles. Then segmented PMax by category and price tier.
Q: Should I run PMax with no segmentation?
A: No. Single PMax campaigns waste budget on what the algo finds easiest. Segment by category and price tier. You will see ROAS lift inside 30 days.

Actions for this section:
- Map your current Google account to the six buckets.
- Split mixed campaigns into Brand vs Generic vs Competition.
- Build one Category PMax and one Product PMax to test.
Creative System: Weekly Is the New Baseline
Andromeda needs volume. PMax needs volume. Both reward 20-30 fresh assets per ad set or asset group.
Monthly creative is dead. Weekly is the new floor.
Here is our weekly creative cadence:
- Five UGC reels.
- Three founder or testimonial reels.
- Two studio statics with hook overlays.
- Two catalog refresh creatives.
- One use-case demo video, 15-30s.
- One winner re-cut with a new hook.
That is 14-15 assets a week. After four weeks, every ad set has a 50-60 creative library. The algo has plenty to test.
Format mix matters as much as count. Reels beat statics for cold traffic. Statics convert warm carts. Demos move new categories.
Hook diversity matters too. The same product needs five hooks. Price, problem, transformation, social proof, FOMO. Run them all.
Spicy Chicken Pickle proved the math. We ran the same cadence with 97.6% Meta spend. Revenue grew from zero to Rs 3.72 Cr in 18 months. Orders: 51,000. AOV: Rs 716. Conversion rate jumped from 1% to 4%.
The hero SKU was Prince Jar. It alone drove Rs 1.06 Cr. That is 28% of total revenue from one product.
A study found ad fatigue hits hardest after seven days of run time. Frequency past 3.0 cuts CTR fast. (Source: Shopify State of Commerce, 2024 — shopify.com)
Q: How often should I refresh creative?
A: Weekly. Andromeda rewards diversity. We ship four new variants a week per active campaign. Plan on 14-15 assets total per week.
The winner re-cut is the highest-impact asset of the week. Last week's top creative gets a new hook. Same body. Fresh opener.
This trick keeps a winning concept alive for months. We have run single concepts for 90 days with new hooks each week.

Actions for this section:
- Block one studio day a week for shoots.
- Brief 4 UGC creators on rolling 7-day cycles.
- Set a weekly winner re-cut as a Friday ritual.
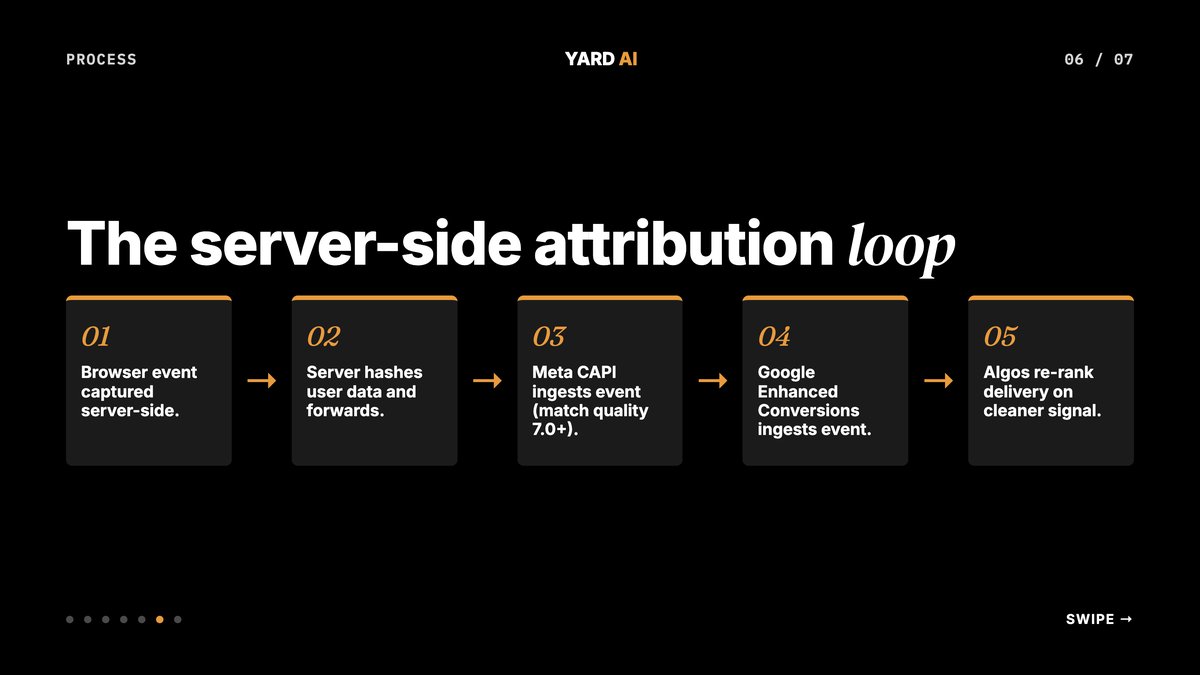
Attribution: Close the Signal Loop
Bad data wastes good media. Layer your attribution stack last.
Three pieces matter:
- Server-side tracking. Use Cometly, Northbeam, or GTM Server-Side.
- Conversion sync. Push clean events back to Meta CAPI and Google Enhanced Conversions.
- Weekly performance reports. Auto-deliver to Slack each Monday.
Brands hit by iOS and cookie loss can recover 20-30% of attribution this way. The platforms then optimize on better data. ROAS rises as a result.
Server-side is no longer optional. Browser tracking misses too much. iOS strips referrers. Safari blocks cookies. Chrome is moving the same way.
The fix is simple in concept. Capture conversions on your server. Send them back to Meta and Google through their server APIs. The platforms re-rank delivery on cleaner data.
Andromeda is signal-hungry. Feed it clean data and it pays back fast. Starve it and creative does not save you.
Q: Is server-side tracking worth the setup cost?
A: Yes. Brands recover 20-30% of attribution. That signal flows back to Meta and Google. The algos optimize harder. ROAS lifts within 30 days.
Event match quality is the metric to watch on Meta. Aim above 7.0. Below that and CAPI is wasted.
On Google the equivalent is Enhanced Conversions diagnostics. Run a weekly check. Fix any errors fast.
Actions for this section:
- Audit Meta event match quality. Aim for 7.0 or higher.
- Validate Enhanced Conversions in Google diagnostics.
- Pipe weekly ROAS into Slack on a Monday cron.
What Goes Wrong Most Often
Three failure modes show up on stuck accounts.
The first is skipping the foundation. Teams jump straight to creative. Fresh ads run on broken tracking. Numbers do not move. This is the most common pattern in D2C.
The second is frozen creative. The architecture is right but the ad library is stale. ROAS spikes for two weeks then drifts down. Creative fatigue under Andromeda is real and fast.
The third is one-channel reliance. Meta-only at scale or Google-only at scale. One algo update can kill a quarter. Most brands need both channels above $50K monthly spend.
Q: Which failure mode is the most common?
A: Frozen creative. Most brands ship monthly. Andromeda eats monthly creative for breakfast. Weekly is the new floor.
The fix for all three is the same. Run the four levers. In order. Every week.
The first 30 days fix the most. Foundation, Merchant Center, and architecture move ROAS by 30-50%. Creative cadence and attribution layer on top.
Actions for this section:
- Audit which failure mode is hitting you.
- Fix the foundation before you fix the ads.
- Set a weekly cadence for creative and reports.
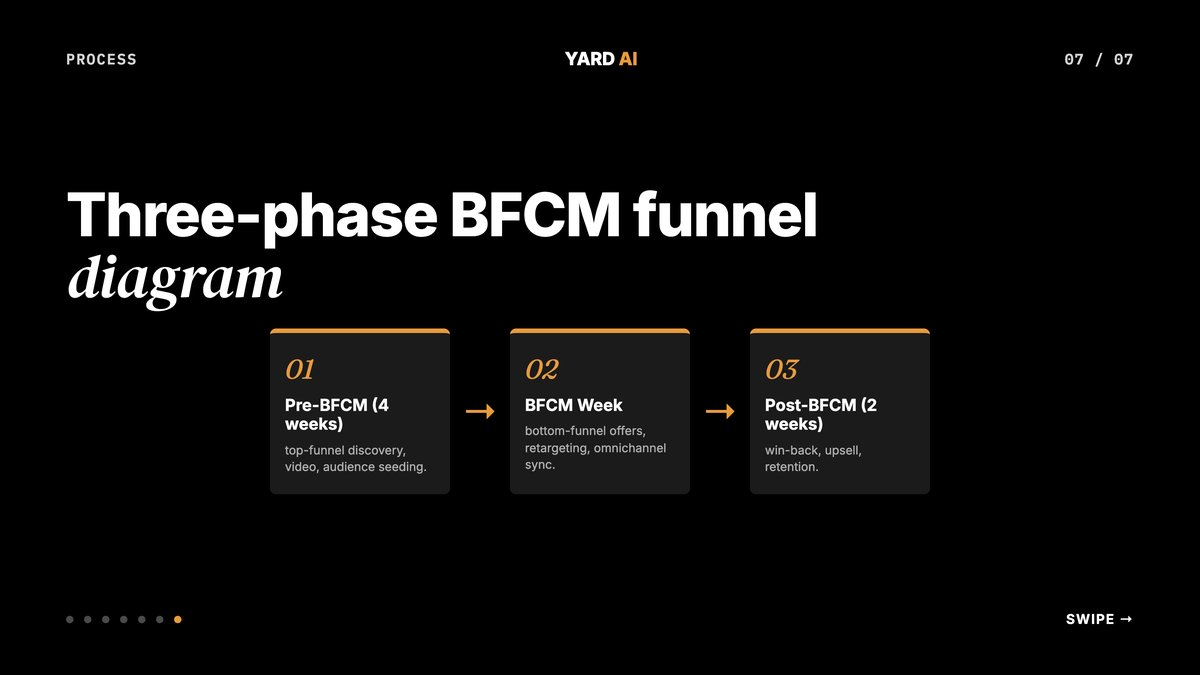
The BFCM Omnichannel Playbook
The BFCM Omnichannel Playbook is the seasonal layer on top of the stack. It is three phases on Google plus Meta.
a US luxury D2C brand ran this in November 2025. The result was a 32x peak ROAS. BFCM week pulled $122K on $2,498 spend.
The three phases:
- Pre-BFCM, 4 weeks out. Top-funnel discovery, video creative, audience seeding.
- BFCM week. Aggressive bottom-funnel offers, retargeting, all channels in sync.
- Post-BFCM, 2 weeks. Win-back to buyers, related-product upsell, retention setup.
The pre-runway is the part most brands skip. Four weeks before BFCM you need to seed audiences. Run discovery video. Build retargeting pools.
When BFCM week hits, those pools become your warm base. The offer lands on people who already know the brand. CPMs drop. CTRs lift.
Post-BFCM is the second part most brands skip. The holiday traffic does not stop on December 1. Win-back to BFCM buyers. Cross-sell related SKUs. Set up email and SMS flows.
According to Adobe, Cyber Week 2024 hit a record $40.6B in US online sales. Brands without a 4-week pre-runway left money on the table. (Source: Adobe Digital Economy Index, 2024 — business.adobe.com)
For Indian brands the same playbook runs across the festival calendar. Diwali, Holi, Raksha Bandhan, regional new years. Each one is a mini-BFCM with its own four-week ramp.
The math holds across markets. Pre-warm the audience. Hit hard on event week. Win back after. Skip any phase and the ROAS drops.
Run the playbook on every season. Compounding wins.
Quick Facts: BFCM result 2025
- Peak ROAS: 32x in BFCM week.
- BFCM week revenue: $122K from 123 orders.
- BFCM week spend: $2,498.
- Total Mar-Dec 2025 ad revenue: $400K on $37,871 spend.
- 1,111 conversions in 10 months.
Actions for this section:
- Lock your BFCM creative brief 6 weeks out.
- Build a 3-phase media plan on Google and Meta.
- Pre-warm CAPI and Enhanced Conversions a month early.
Want the Full Playbook?
Most teams are running the old playbook. We have already shipped the new one.
YARD is an AI-first growth marketing agency. We ran this exact playbook on a US luxury D2C brand in Hawaii. The brand sells luxury furniture, jewelry, and art with a $15 to $15,000 price range. Founded in 1961.
The numbers tell the story. ROAS moved from 2x to 10.6x. BFCM peaked at 32x. Total ad revenue hit $400K on $37,871 spend in 10 months. That is 1,111 conversions on a luxury price point.
We ship in three phases:
- Foundation. Merchant Center Optimization, Enhanced Conversions, and CRO sticky ATC.
- Google Architecture. Brand Search, Product Shopping, segmented PMax.
- Meta Activation. Dual-Funnel Meta Architecture plus the BFCM Omnichannel Playbook.
The same playbook adapts to other verticals. a footwear brand in the UAE hit 4x revenue. a footwear brand hit 7.4x. Spicy Chicken Pickle in India hit Rs 3.72 Cr from zero in 18 months.
The pattern repeats because the math repeats. Get tracking right. Get titles right. Get architecture right. Get creative right.
Want to see how we would apply this to your vertical? Visit yardagency.ai and download the playbook. We will run a 5-day audit and ship a prioritized 30-day plan.
FAQ
Q: What ROAS should an ecommerce brand target in 2026?
A: Blended target depends on margin. For a 60-70% gross margin brand, aim 3-4x. For a 40% margin brand, aim 5x or more. Meta needs about 2.5x to be profitable. Google Search needs about 4x and PMax about 3x.
Q: What is the single biggest ecommerce roas optimization lever?
A: Merchant Center Optimization. Rewrite product titles to match real search queries. Lead with category, not brand. Every YARD client sees a Shopping ROAS lift in the first month.
Q: How long does the playbook take to show results?
A: Phase 1 takes 2-4 weeks. It moves ROAS by 30-50%. Phase 2 takes 8-12 weeks. Most clients see 2-4x revenue lift in 90 days. a footwear brand hit 4x in 12 months. a footwear brand hit 7.4x in 6 months.
Q: Do I need both Meta and Google to run this?
A: For most D2C brands, yes. Meta builds discovery. Google captures intent. Spicy Chicken Pickle ran 97.6% Meta and hit Rs 3.72 Cr in 18 months. That is a category exception. Most brands need both at scale.
Q: What kills ecommerce ROAS the fastest?
A: Broken tracking, frozen creative, and one-channel reliance. Without CAPI and Enhanced Conversions, every other lever steers on bad data. Without weekly refresh, fatigue compounds. Without channel mix, one algo change can wipe a quarter.
Q: Does this work for sub-$50K monthly revenue brands?
A: Some of it. Merchant Center, tracking, and basic Meta plus Google structure are universal. The 6-Campaign Google Ads Architecture is heavy below $30K monthly. The breakpoint is usually 8-10 SKUs and 100 orders a month.
Q: How often should I refresh creative?
A: Weekly. Andromeda rewards diversity. We ship 4 fresh variants a week per active campaign. Plan on a 14-15 asset weekly cadence. After a month, every ad set has a 50-60 creative library.
Insights from Our Experts
Explore our latest articles on digital marketing strategies.