

Your Ads Manager says 4.2x. Your accountant says the month was flat.
Both are right. They are measuring different numbers, and only one of them pays salaries.
Platform ROAS is built on media spend. Everything else that makes an ad cost money sits outside it. Fees. Taxes. Tools. Agency retainers. Payment charges.
Meanwhile your analytics is under-crediting some channels and over-crediting others. So the top line is wrong and the split is wrong.
This piece covers every place spend hides. Then how to rebuild the number on all-in cost. Then the monthly routine that keeps it honest.
None of it needs new software. It needs one spreadsheet and a rule about where numbers come from.
Quick Facts: The ROAS Reporting Gap at a Glance
- Meta began charging location fees on 1 July 2026 in six markets — (Source: TDMP, 2026 — tdmp.co.uk).
- Rates run 5% in Austria and Turkiye, 3% in France, Italy and Spain, 2% in the UK — (Source: Digital Applied, 2026 — digitalapplied.com).
- The fee is charged by delivery country, not by where your business sits — (Source: TDMP, 2026 — tdmp.co.uk).
- Some 70.6% of AI-driven visits arrive with no referrer and land in Direct — (Source: Seresa, 2026 — seresa.io).
- Consent Mode v2 is a hard requirement for EU, EEA and UK targeting — (Source: PPC Land, 2026 — ppc.land).
Where the spend actually hides
Start with the definition problem. Platform ROAS is revenue divided by media spend.
That denominator is smaller than your real cost. Sometimes much smaller.
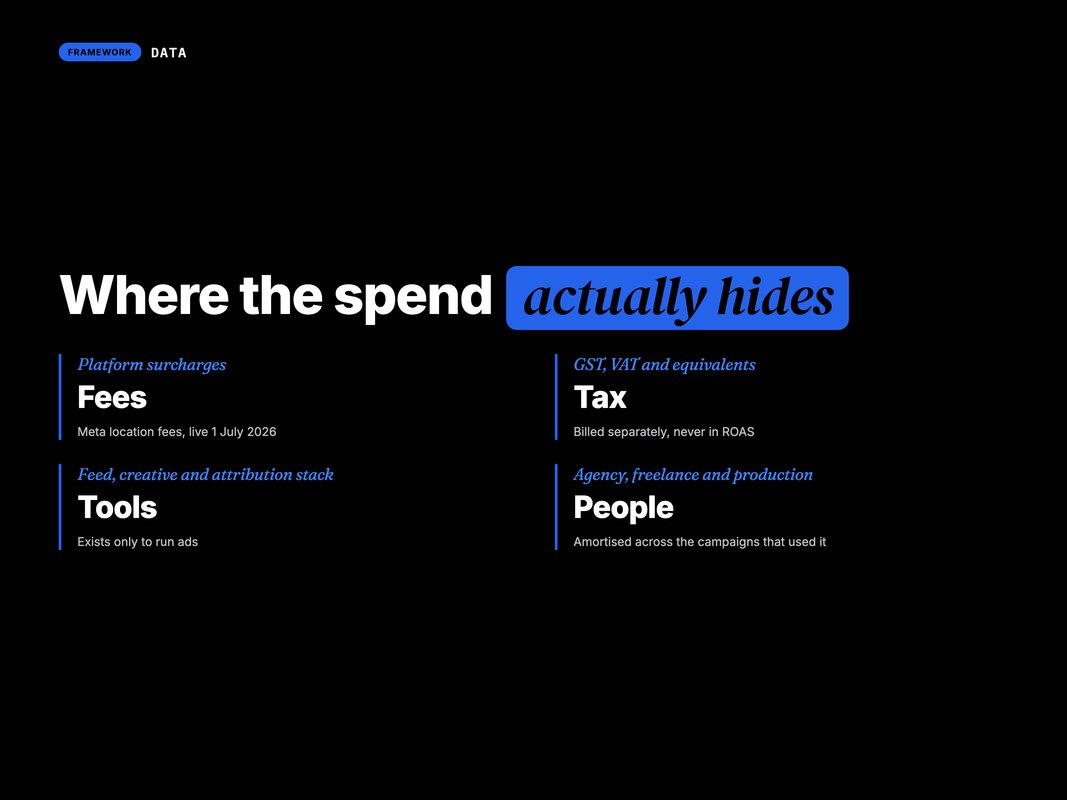
Six lines commonly sit outside it.
Platform fees and surcharges. The clearest current example is Meta's location fee, live since 1 July 2026.
Taxes. GST, VAT and equivalents are billed separately in most markets and never touch the ROAS calculation.
Payment and currency costs. Cross-border card charges and conversion spreads on a foreign-currency ad account.
Tool subscriptions. Attribution platforms, creative tools, feed managers, landing page builders. All of it is customer acquisition cost.
Agency and freelancer fees. Whether a retainer or a percentage of spend.
Creative production. Shoots, editors, licensing. Amortise it across the campaigns that used it.
Add those up. On most accounts we audit, the real cost sits well above the media number.
That is the whole difference between a campaign you scale and one you should have paused.
Two of those six catch people out most often.
Tool spend gets treated as overhead rather than acquisition cost. But a feed manager exists only to run ads. It belongs in the denominator.
Creative production gets ignored because it is lumpy. A shoot in March is not a March cost. Spread it across the months the assets actually run.
Q: Should agency fees really go in ROAS?
A: For a business decision, yes. If you are asking "did this channel make money", every cost required to run it belongs in the denominator. Keep a media-only view too, for optimisation.
The Meta location fee, as a worked example
This one is worth walking through because it is recent, specific, and invisible in most reports.
From 1 July 2026, Meta charges a surcharge on ads delivered in six markets (Source: TDMP, 2026 — tdmp.co.uk).
| Market | Location fee |
|---|---|
| Austria | 5% |
| Turkiye | 5% |
| France | 3% |
| Italy | 3% |
| Spain | 3% |
| United Kingdom | 2% |
The fee follows delivery, not your registered address. Serve ads to UK audiences from Mumbai and you still pay the UK rate (Source: Digital Applied, 2026 — digitalapplied.com).
It is added on top of your budget and appears as a separate billing line. So your campaign ROAS does not move at all.
Here is what that does to the maths.
Say you spend ₹1 crore on French audiences at a reported 3x. That returns ₹3 crore. The 3% fee adds ₹3 lakh of real cost that never enters the calculation.
On a 33% margin, break-even is about 3x. So the campaign your dashboard calls a winner is, on all-in cost, slightly under water.
We covered the fee itself in more detail in Meta's Location Fees (July 2026): What UK & EU Advertisers Pay Now.
The other half: attribution under-reporting
Hidden spend inflates ROAS. Broken attribution scrambles the split between channels.
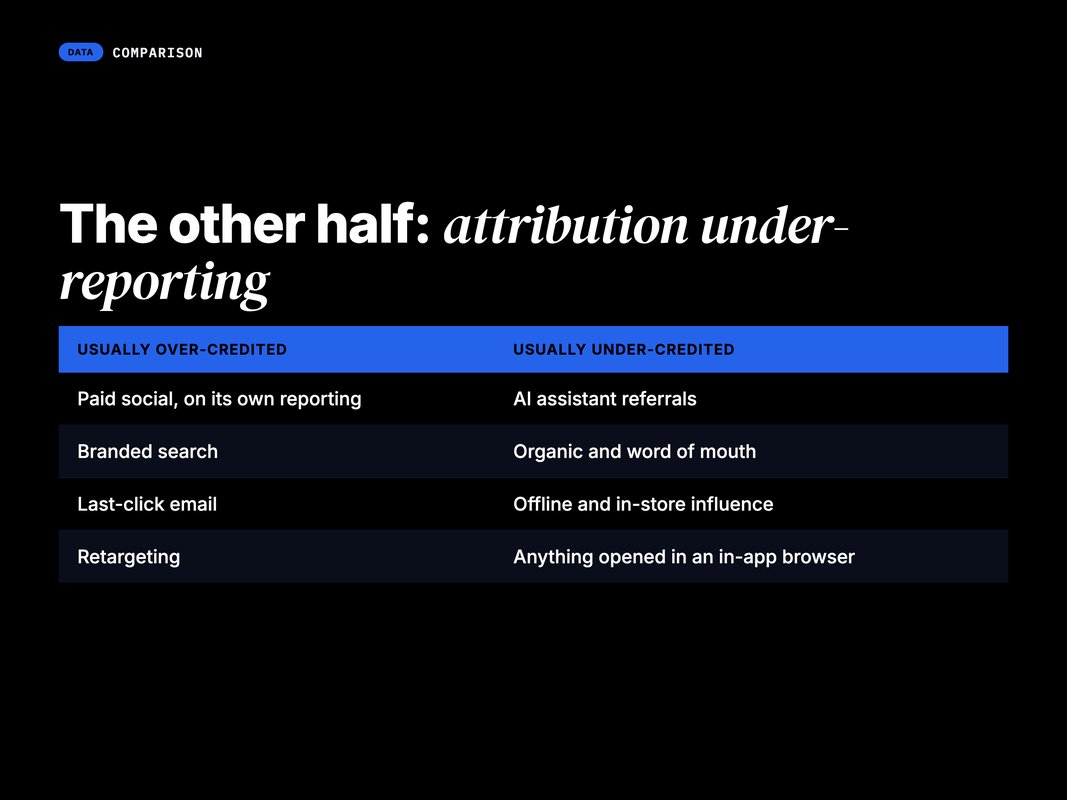
Three things are doing most of the damage right now.
AI referrals land in Direct. Loamly's analysis of 446,405 visits found 70.6% of AI-driven traffic arrives with no referrer header (Source: Seresa, 2026 — seresa.io). GA4 has nothing to read, so it files the visit as Direct.
Consent Mode modelling. For EU, EEA and UK targeting, Consent Mode v2 is now a hard requirement. Conversion modelling fills the gap left by users who decline. It needs a large enough pool of consented sessions to work (Source: PPC Land, 2026 — ppc.land). Smaller accounts in high-refusal markets may never clear that bar.
Platform self-reporting. Every platform claims conversions its own way, on its own window. Add up all your platform-reported conversions and you will usually exceed your actual order count.
So you have three numbers that disagree. The platform says one thing. GA4 says another. Your order system says a third.
Only one of those is real revenue.
The instinct is to pick a winner and force the others to match it. Do not. They measure different things and they will never agree.
Give each number a job instead. The platform decides which ad to scale. Analytics shows channel direction over time. The order system reports money.
Once each number has one job, the arguments stop. And the reporting gets faster, because nobody is reconciling three tools every Monday.
Q: Which number should I trust?
A: Your order system, always. Platforms and analytics are for direction and optimisation. Money comes from the system that took the payment.
Rebuild the number on all-in cost
The fix is arithmetic, not tooling. Four steps.
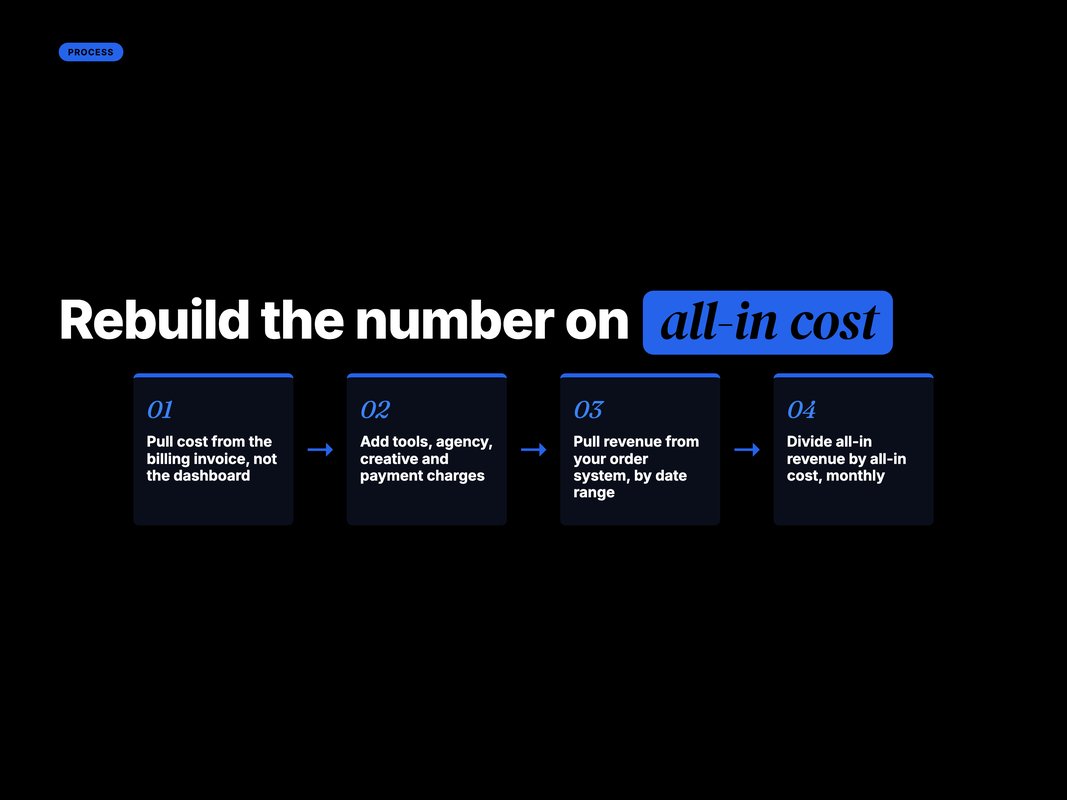
Step one: pull cost from invoices, not dashboards. The billing export is the truth. It includes fees and taxes. The Ads Manager view does not.
Step two: add the off-platform costs. Tools, agency, creative, payment charges. Allocate them by share of spend if you cannot attribute them directly.
Step three: pull revenue from your order system. Not from the platform. Match by date range, not by attribution window.
Step four: divide. All-in revenue over all-in cost. That is your real blended ROAS.
Do it monthly, at the account level first. Channel-level all-in ROAS is useful but harder, because shared costs need allocating.
Most teams find the blended number sits meaningfully below what they were reporting. That is uncomfortable, and far better known than not.
Set it up once in a spreadsheet with four tabs. Invoice cost. Off-platform cost. Order revenue. The blended result.
Do not build this in a BI tool on day one. A spreadsheet you actually update beats a dashboard nobody trusts.
Move it into your reporting stack only after three months of the manual version. By then you will know exactly which fields matter.
Reset your break-even, then your targets
A ROAS number means nothing without a break-even to compare it against.
The formula is simple. Break-even ROAS equals one divided by your contribution margin.
| Contribution margin | Break-even ROAS |
|---|---|
| Margin of 20% | 5.0x |
| Margin of 25% | 4.0x |
| Margin of 33% | 3.0x |
| Margin of 40% | 2.5x |
| Margin of 50% | 2.0x |
Now add the fees. Whatever share your all-in cost adds on top of media spend, your effective break-even rises by roughly that same share.
A brand on a 33% margin does not need 3x. On all-in cost, it needs closer to 3.5x.
That single adjustment changes which campaigns you scale. It is the single most useful change in this piece.
Work the margin out properly while you are here. Contribution margin is revenue minus cost of goods, shipping, payment fees and returns.
Not gross margin. Not the number in the deck from last year. The real one, for the products your ads actually sell.
Many brands discover their blended margin is several points below what they assumed. That moves break-even more than any fee does.
Then check it by product line. A brand selling two categories at different margins needs two break-even targets, not one blended guess.
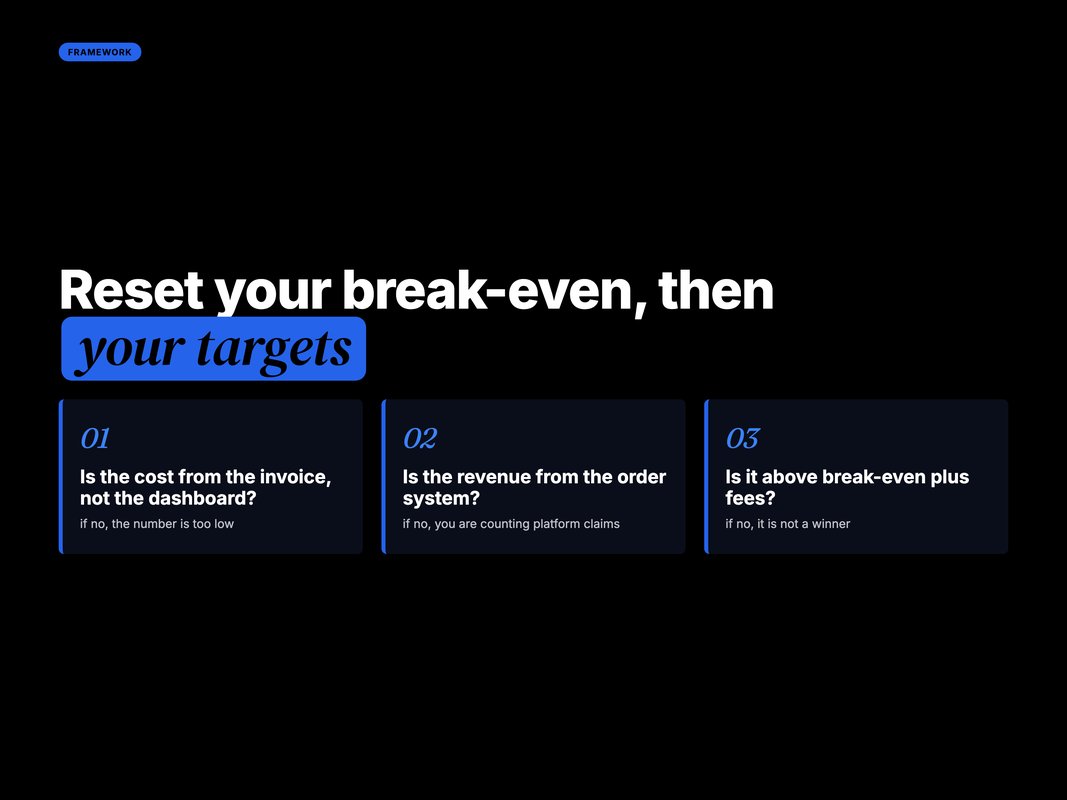
Set the target once, in writing, and hold every campaign to it. Not the platform's default ROAS goal. Yours.
The monthly routine that keeps it honest
This takes about 90 minutes a month once it is set up.
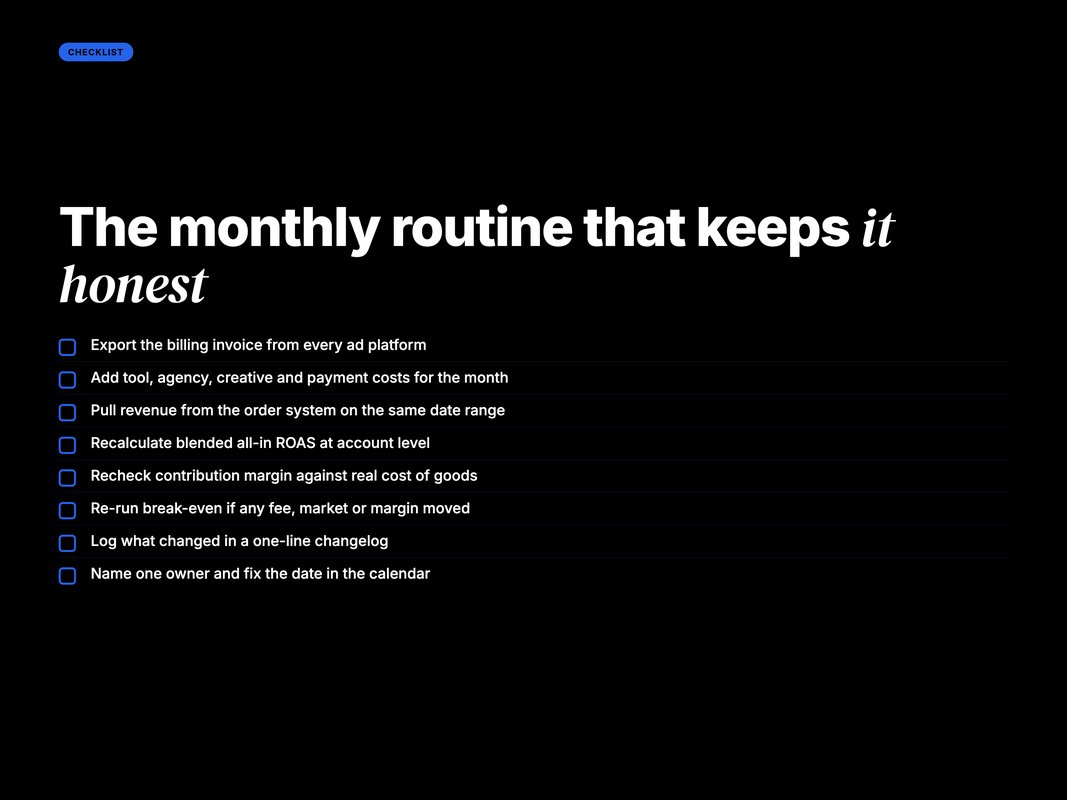
Two habits matter more than the rest.
Reconcile against the invoice every month. Not the dashboard. Platforms change fee structures without announcing it in the interface, and the invoice is where you find out.
Re-run the break-even whenever anything changes. New market, new fee, new tool, changed margin. Any of those and the target moves.
There is one more worth adding. Keep a short changelog of what moved and when.
One line per change is enough. Date, what changed, and the effect on the blended number.
This is the step teams skip, and it is the one that saves you in a quarterly review. A number that drops without explanation looks like failure. The same drop with a dated reason looks like control.
Assign the routine to one person. Shared ownership here means nobody does it in month three.
And put it in the calendar on the same day each month, right after invoices land. If it floats, it stops happening.
A board will ask why the reported number dropped. The good answer is that you added fees and taxes to the denominator in August. Silence is not an answer.
It is the first thing we fix on a new account, and the base of our E-Commerce ROAS Optimization playbook.
What we do at YARD
We are an AI-first growth marketing agency. We run performance marketing, LLM SEO, AI creative and AI funnels for D2C and B2B brands.
Nearly every account we take over has this problem. The reporting is not dishonest. It is just built on the platform's definition of cost, which was never designed to answer a business question.
So the first thing we do is rebuild the number. Invoices for cost. Order system for revenue. Every fee and tool included. One blended figure everyone agrees on.
The conversation that follows is usually uncomfortable and always useful. The headline figure drops. And suddenly the debate about which campaigns to scale has a real answer.
We also fix the reporting so it stays fixed. One monthly reconciliation, one source per number, one changelog. It is not sophisticated work. It is the work that makes every other decision correct.
If your reported ROAS and your profit have been drifting apart, that gap has a name and it is measurable. We can find it in a week.
The takeaway
Platform ROAS is a media metric. Your business needs a business metric.
The gap between them comes from two directions. Costs the platform leaves out, and traffic your analytics cannot see.
Fix the first with arithmetic. Pull cost from invoices, add every off-platform line, take revenue from your order system.
Fix the second by accepting the limits. Trust the order system for revenue. Use platforms for direction. And stop expecting three tools to agree.
Neither fix needs a new vendor. Both need a decision about which number counts.
Make that decision this month, before the next planning cycle. A budget built on the wrong denominator gets defended for a whole quarter.
Then reset your break-even on all-in cost. That one number decides what you scale, and most teams have it set too low.
You can book a call with our team if you want us to rebuild yours.
FAQ
Q: Why does my dashboard ROAS look better than my bank balance?
A: Because platform ROAS uses media spend only. Fees, taxes, tool costs and agency fees sit outside it. Your profit and loss picks them all up a few weeks later.
Q: What are Meta's location fees?
A: From 1 July 2026, Meta adds a surcharge on ads delivered in six markets. The rate is 5% in Austria and Turkiye. It is 3% in France, Italy and Spain, and 2% in the UK. The fee sits on top of your budget.
Q: Do location fees show up in ROAS?
A: No. The fee sits outside media spend as its own billing line. Your reported ROAS stays the same while your real cost rises, so you have to add it manually.
Q: Why is my AI traffic missing from GA4?
A: Many AI apps open links in an in-app browser that passes no referrer. Loamly's analysis of 446,405 visits found 70.6% of AI-driven traffic arrives with no referrer at all. GA4 files it as Direct.
Q: How do I calculate break-even ROAS?
A: Divide one by your contribution margin. A 33% margin needs about 3x to break even. Then add every fee and tool cost on top before you call a campaign profitable.
Q: How often should I rebuild the all-in number?
A: Monthly, from the invoice rather than the dashboard. Rebuild it immediately whenever a platform changes fees, a market is added, or you add a tool to the stack.
Insights from Our Experts
Explore our latest articles on digital marketing strategies.