

Yes. The data on this is no longer ambiguous.
The useful question is how much, on which queries, and what still earns a visit. That part is more interesting than the headline.
Two studies define the picture. Pew Research tracked real browsing behaviour. SparkToro measured clickstream data at scale. They agree on direction and they agree on rough size.
This piece pulls both apart. Then it covers the pages that still get clicked, and the three moves worth making this quarter.
No panic. No "SEO is dead". Just the numbers and what to do about them.
Quick Facts: AI Overviews and Clicks at a Glance
- Users clicked a result on 8% of visits with an AI summary, against 15% without — (Source: Pew Research Center, 2025 — pewresearch.org).
- Only 1% of visits included a click on a link inside the summary — (Source: Pew Research Center, 2025 — pewresearch.org).
- Sessions ended on 26% of AI summary pages, against 16% without — (Source: Pew Research Center, 2025 — pewresearch.org).
- Zero-click searches reached 68.01% of US Google searches in early 2026 — (Source: SparkToro, 2026 — sparktoro.com).
- Wikipedia, YouTube and Reddit made up 15% of sources cited in AI summaries — (Source: Pew Research Center, 2025 — pewresearch.org).
What Pew actually measured
Most numbers you see quoted on this topic come from tool vendors. Pew is different. It watched real people browse.
The study tracked 900 US adults who agreed to install a browsing monitor. It covered March 2025 and logged 68,879 unique Google searches. Of those, 12,593 produced an AI summary (Source: Pew Research Center, 2025 — pewresearch.org).
The core finding is a near halving.
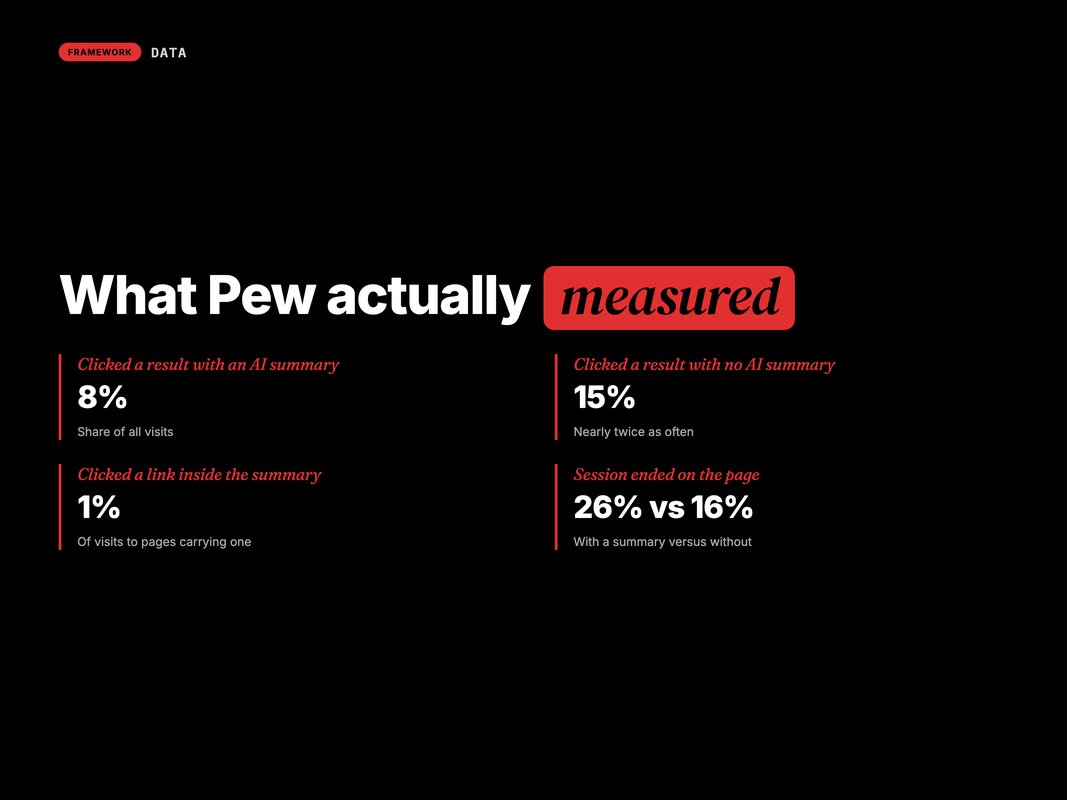
With an AI summary present, users clicked a traditional search result on 8% of visits. Without one, they clicked on 15% of visits.
Two secondary findings matter as much as the headline.
First, people rarely click the citations inside the summary. That happened on just 1% of visits to pages carrying one.
Second, sessions end more often. Users ended their browsing session on 26% of pages with an AI summary, against 16% of pages without one.
That last number is the one to sit with. It is not that traffic moved elsewhere on the page. The visit simply stopped.
Q: Does a citation in an AI Overview send meaningful traffic?
A: No. Pew measured clicks on in-summary links at 1% of visits. Treat the citation as a brand impression, not a traffic source.
The zero-click number, in context
SparkToro measured a different thing at a much larger scale.
Google searches ended without a click 68.01% of the time in the US during the first four months of 2026. That is up from 60.45% in 2024 (Source: SparkToro, 2026 — sparktoro.com).
A 7.56-point rise in two years. Put another way, of every 1,000 searches, 276 now reach a website. In 2024 it was 374.
That is roughly a quarter of your organic opportunity gone, without your rankings changing at all.
One honest caveat. SparkToro does not claim AI Overviews caused all of it. Zero-click search has been rising for a decade, driven by featured snippets, knowledge panels and Google's own properties. AI Overviews accelerated a trend that already existed.
Which is why "AI Overviews killed my traffic" is usually only half true. The other half is that your traffic was already leaking, and this made the leak visible.
Where the losses actually land
The pain is not spread evenly. It concentrates hard on one type of page.
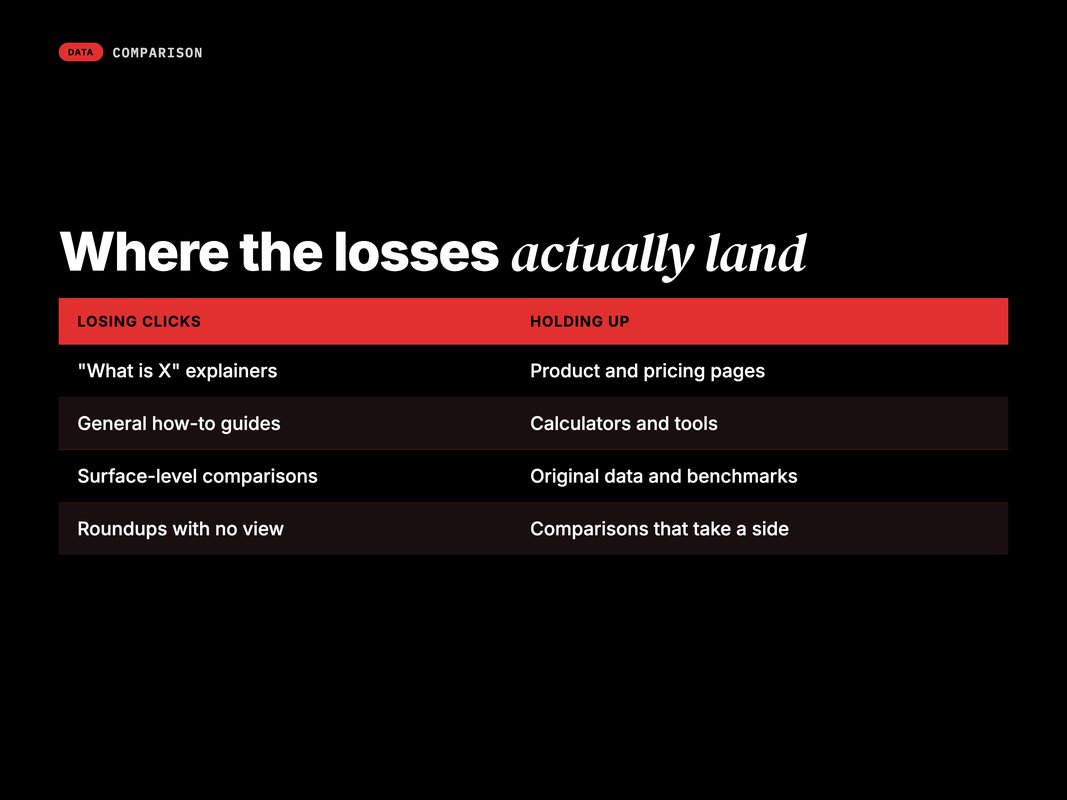
Explainer content takes the hit. "What is X." "How does Y work." "X vs Y" at a surface level. An AI Overview answers those completely, and there is no reason to click.
Buying pages and tool pages hold up. You cannot buy a thing from a summary. You cannot run a calculation, book a slot, or log in to an account.
Here is the pattern by intent.
| Query intent | Overview risk | What to do |
|---|---|---|
| Definition or "what is" | Very high | Keep for citation, stop forecasting traffic |
| How-to, general | High | Add a tool, template or download |
| Comparison, surface level | High | Take a position the model cannot |
| Comparison, hands-on | Medium | Publish original testing |
| Product or pricing | Low | Protect and optimise these first |
| Local and near-me | Low | Maps profile matters more than the page |
| Login, account, checkout | None | Not a search problem |
Audit your top 50 organic pages against that table. Most teams find a third of their traffic sits in the top two rows.
That is your exposure. Not your whole site.
Do the audit in a spreadsheet, not in your head. One row per page. Columns for intent, clicks last year, clicks this year, and risk band.
Sort by clicks lost. The top ten rows are your whole problem. Everything below them is noise you can safely ignore this quarter.
Two things usually surprise people here. The pages losing the most clicks are rarely the pages driving the most revenue. And the pages driving revenue are often the ones nobody has touched in two years.
That mismatch is the real finding. Panic follows traffic. Money follows something else.
Q: Should I delete my explainer posts?
A: No. They still earn citations and they still support topical depth. Just stop counting on them for sessions, and stop writing more of them.
What actually still earns a click
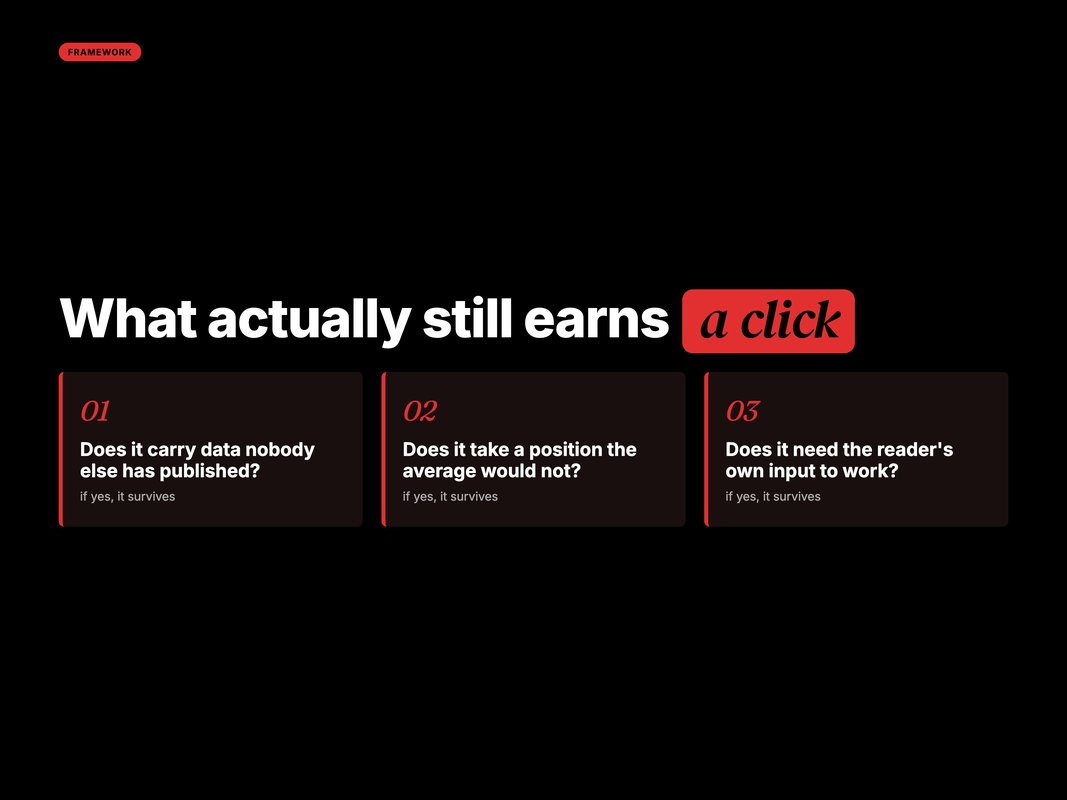
Three things survive an AI Overview. All three are hard to produce, which is exactly why they work.
Original data. A model can summarise an opinion. It cannot generate a number nobody has published. Survey your customers. Publish your benchmarks. Run the test yourself.
A real position. AI Overviews average what the web says. A page with a specific, defensible view that cuts against the average gives someone a reason to read the source.
A tool. Calculators, generators, checkers, templates. If the answer requires the user's own input, no summary can pre-empt it.
Notice what is not on that list. Length. Keyword density. Yet another guide to something already well covered.
Original data is the strongest of the three, and the least used. You do not need a big sample. A hundred customers, one honest question, one chart.
A real position is the cheapest. It costs nothing but nerve. Write the thing your competitors will not say out loud, then back it with a reason.
A tool takes the most work and pays the longest. Once built, it keeps earning clicks with no new content. That is rare in this market.
Wikipedia, YouTube and Reddit accounted for 15% of the sources listed in AI summaries Pew examined (Source: Pew Research Center, 2025 — pewresearch.org). Government sites made up 6% of AI Overview sources. In standard results it was 2%.
Read that as a signal about trust. The model favours sources with clear authority, or a large crowd behind them. A brand blog has neither by default.
How to measure this properly
Most teams measure the wrong thing and then argue about it. Here is a cleaner setup.
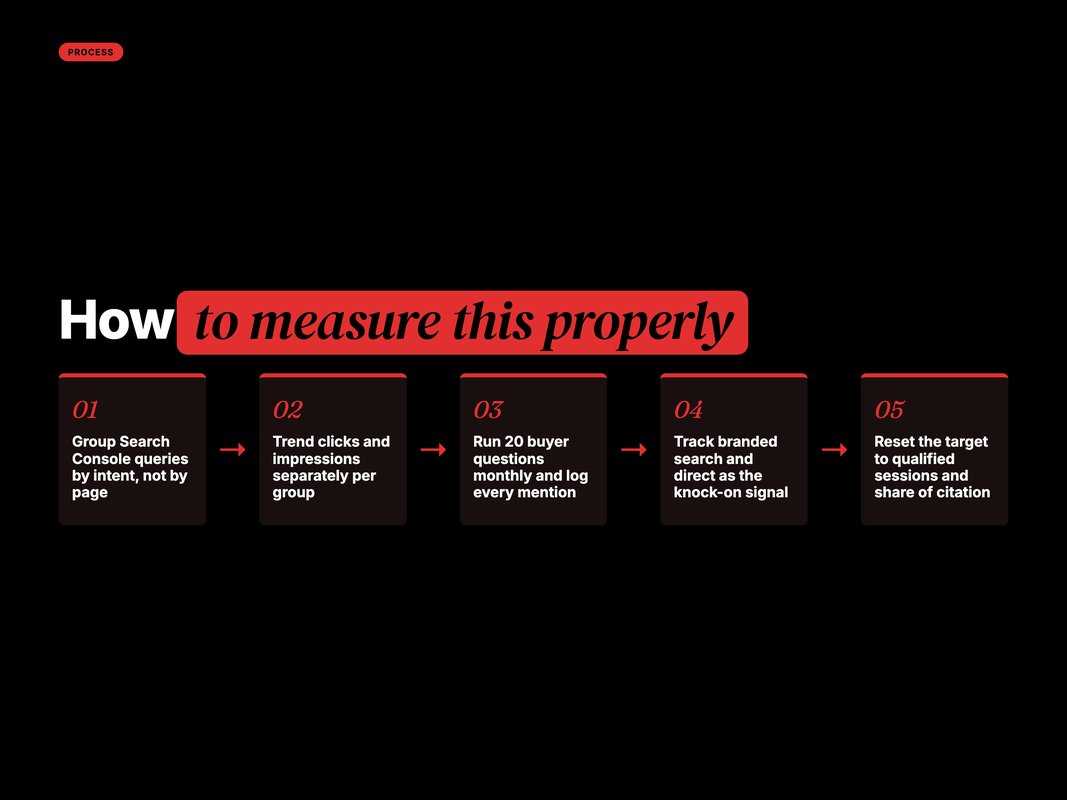
Start by splitting your Search Console data by intent, not by page. Group queries into the seven rows above. Then trend clicks and impressions separately for each group.
You will usually see the same shape. Impressions flat or up. Clicks down. That gap is your AI Overview exposure, quantified.
Next, add a visibility measure. Pick 20 questions your buyers actually ask. Run them monthly. Log whether you were named. This is manual and it is worth it.
Then track the downstream signal. If citations are doing anything for you, it shows up as branded search volume and direct sessions, not as organic clicks.
Finally, set the right target. Organic sessions is no longer a fair goal for explainer content. Qualified sessions and share of citation are.
We set out the wider method in Generative Engine Optimization: Getting Your Brand in AI Answers. The build side sits in SEO After AI Overviews — The Complete Strategy Guide.
What to do in the next 90 days
Four moves, in order of return.
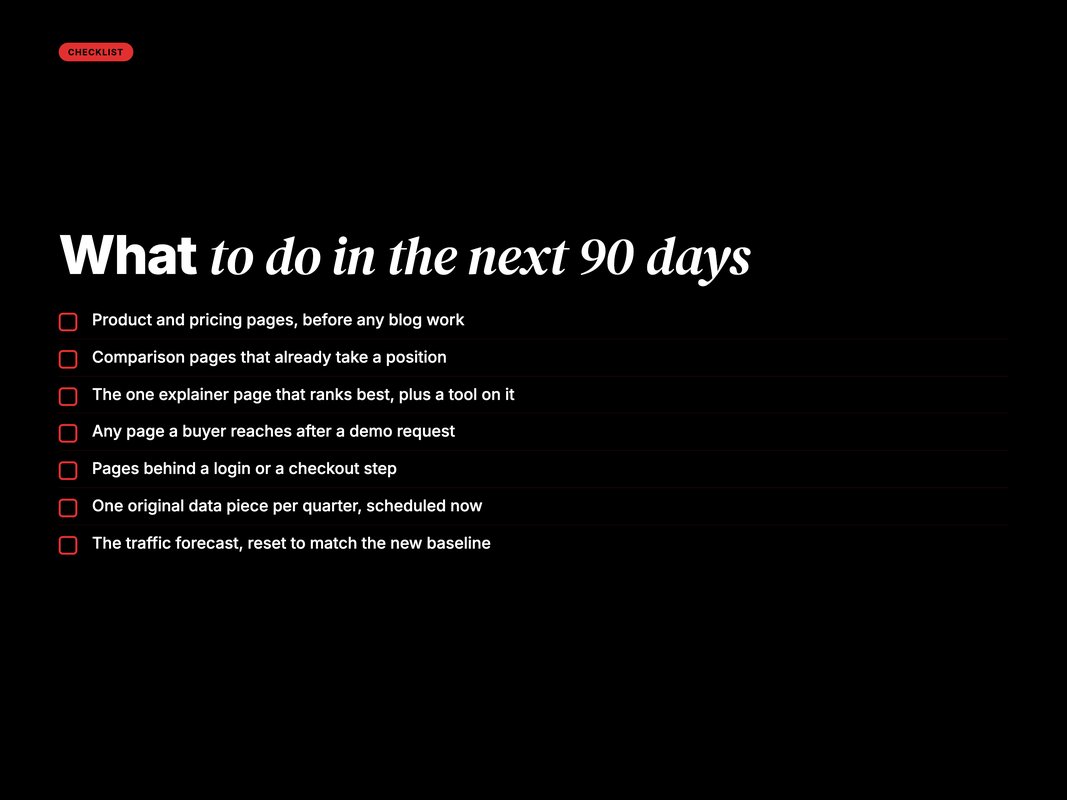
Work down that list before touching anything else.
Protect the low-risk pages first. Product, pricing, comparison pages with a view. These still convert and still get clicked. Most teams neglect them while panicking about blog traffic.
Add a tool to your best explainer page. One calculator or template on the page that already ranks. It is the cheapest way to make a page hard to summarise.
Publish one piece of original data per quarter. Your own numbers, from your own customers or your own tests. This is the single highest-leverage content investment available right now.
Reset the forecast. Your plan may assume organic sessions growing 20% this year on explainer content. That plan is wrong. Fix it before the board meeting, not after.
None of this is a rebuild. It is a reallocation.
Give it one quarter. Do the audit in week one. Pick the ten pages that matter. Then work only on those.
Most teams fail here by trying to fix everything. The exposure is concentrated, so the fix should be too.
And tell the wider business what changed. A quiet 25% drop in organic clicks looks like a team failing. The same drop, explained with the numbers above, looks like a market shift you saw coming.
That framing is not spin. It is the difference between a budget cut and a budget reallocation.
One last note on timing. Google keeps changing where AI Overviews appear. A query that shows one this month may not next month.
So re-run the audit each quarter. Not each week. The shape moves slowly enough that monthly checks are mostly noise.
Set a calendar reminder now. Then get back to the ten pages that matter.
What we do at YARD
We are an AI-first growth marketing agency. We run performance marketing, LLM SEO, AI creative and AI funnels for D2C and B2B brands.
The work here starts with an honest audit. We split your organic pages by intent, quantify how much of your traffic sits in the high-risk rows. Show you the real exposure number.
Most clients are surprised twice. Once by how much traffic is at risk. Then again by how much of their converting traffic never was.
From there we do three things. We protect and sharpen the pages that still earn clicks. We add tools or original data to the pages worth saving. And we set up citation tracking so you can see visibility even when the click does not come.
We also fix the forecast. A traffic target built on 2023 assumptions will fail this year no matter how good the content is. Better to reset it deliberately than to miss it quietly.
None of this requires a new CMS or a rebuild. It requires deciding which pages are for citation and which are for clicks, then treating them differently.
The takeaway
AI Overviews do reduce clicks. Pew measured 8% against 15%, and zero-click search has reached 68% of US Google searches.
But the loss is concentrated. Explainer and general how-to content is where it lands. Product, pricing, tools and original data hold up.
So the response is not to write more or to write less. It is to write different things, and to stop measuring the survivors with the metric that fits the casualties.
Audit your top 50 pages by intent this week. The exposure number will be smaller than you fear and more specific than you expect.
You can book a call with our team if you want us to run that audit with you.
FAQ
Q: Do AI Overviews reduce clicks?
A: Yes. Pew Research tracked 900 US adults. People clicked a search result on 8% of visits when an AI summary appeared. Without one, they clicked on 15% of visits.
Q: What share of Google searches end without a click?
A: About 68% of US Google searches ended without a click in early 2026. That comes from SparkToro, using Similarweb clickstream data. It was 60.45% in 2024.
Q: Do people click the links inside an AI Overview?
A: Rarely. Pew found users clicked a link inside the summary on just 1% of visits to pages that carried one. The citation is visibility, not traffic.
Q: Which pages still earn clicks?
A: Pages an AI Overview cannot replace. Buying pages. Tools and calculators. Original data. Comparisons with a real view. And anything behind a login.
Q: Is being cited in an AI Overview worth anything?
A: Yes, but not as traffic. Treat it as a brand impression. Measure how often you get named for your key questions. Then track branded search and direct visits as the knock-on effect.
Q: Should we stop publishing explainer content?
A: No. Change what it is for. Thin explainer posts are gone. Content with original data, a strong view, or a tool attached still earns citations and visits.
Insights from Our Experts
Explore our latest articles on digital marketing strategies.