

Ask a marketer how a campaign is doing. They'll quote a ROAS. Ask a founder if the business is making money. You'll often get the same number back. That's the problem. ROAS and ROI sound alike. But they answer different questions. Confusing them is how brands scale a campaign into a loss. Here's the difference, the math, and which one to trust.
What is ROAS?
ROAS means Return on Ad Spend. It measures revenue earned for every rupee spent on ads. Spend ₹1,00,000, earn ₹5,00,000 back, and you have a 5x ROAS. It is fast and channel-level. It is great for comparing creatives, campaigns, and platforms in near-real time.
There is a catch. ROAS is a gross revenue metric. It sits at the top of your P&L. It knows nothing about what happens below it. It ignores cost of goods, shipping, returns, payment fees, and overhead. A high ROAS tells you the ad worked. It does not tell you the business made money.

What is ROI?
ROI means Return on Investment. It measures actual profitability. It accounts for total cost. That includes COGS, logistics, returns, platform fees, and the fixed costs of running the company. ROI maps to your bank balance, not your ad dashboard.
ROAS judges a channel. ROI judges the whole business. That is why a marketing team can be thrilled and a finance team nervous about the same campaign.
The formulas
ROAS = Revenue ÷ Ad Spend
ROI = (Profit − Total Cost) ÷ Total Cost
One middle metric is underused: contribution margin. It is revenue minus all variable costs, shown as a percentage. Variable costs include COGS, shipping, returns, and fees. It is the cleanest bridge between a ROAS and real profit.
Worked example
Let's run one campaign through both lenses.
Revenue: ₹5,00,000
Ad spend: ₹1,00,000
ROAS = 5x — looks excellent.
Now layer in the real costs:
COGS (40% of revenue): ₹2,00,000
Shipping, returns, and fees (15%): ₹75,000
Ad spend: ₹1,00,000
Total cost: ₹3,75,000
Profit: ₹1,25,000
That 5x ROAS leaves ₹1,25,000. And that is before salaries, rent, and software. It is healthy-ish, but thinner than 5x suggested. Now drop the product margin. If COGS climbs and contribution margin falls to 25%, that same 5x ROAS tips into a loss. The scoreboard didn't change. The economics did. This gap is not rare. Median D2C contribution margin fell from 35% in 2021 to 22% in 2025, per D2C benchmark data from Fairview. The cause was simple. Paid acquisition kept getting pricier.
Break-even ROAS
This is the number every brand should know cold:
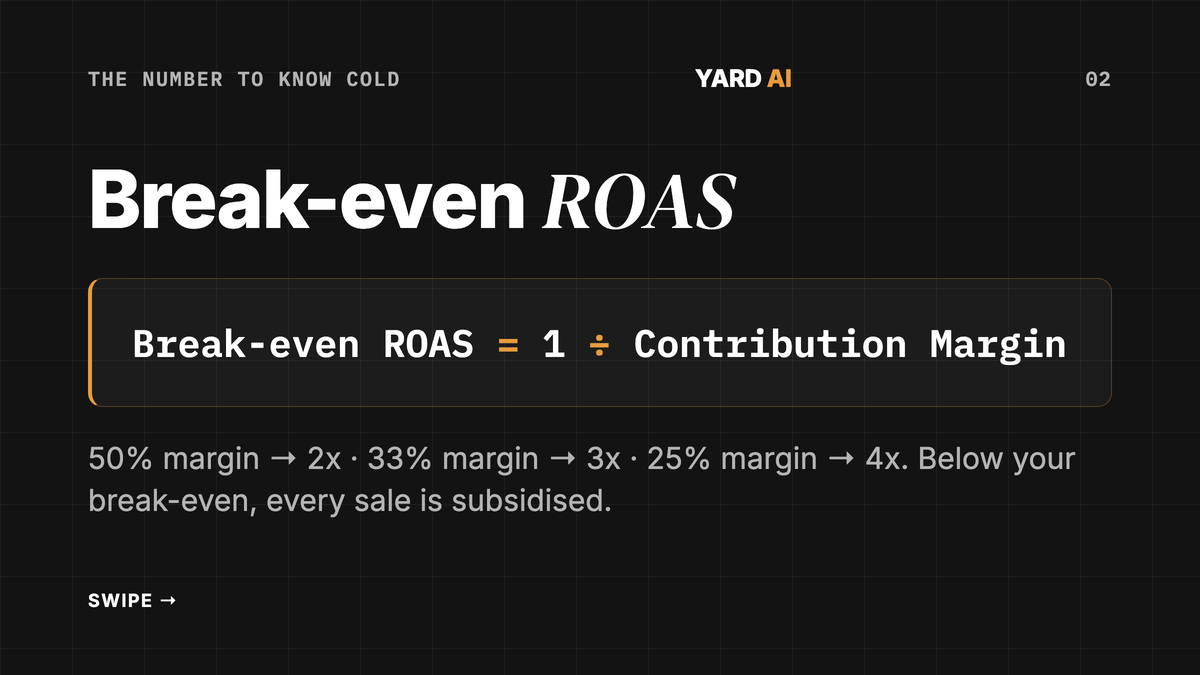
Break-even ROAS = 1 ÷ Contribution Margin
50% margin → break even at 2x
33% margin → break even at 3x
25% margin → break even at 4x
This is definitional math, not a guess. Triple Whale confirms the same relationship: a 50% margin sets break-even at exactly 2x. Below your break-even ROAS, every sale is subsidised. Above it, you grow profitably. Without this number, 'good ROAS' is just a vibe.
Why platform ROAS lies a little (attribution)
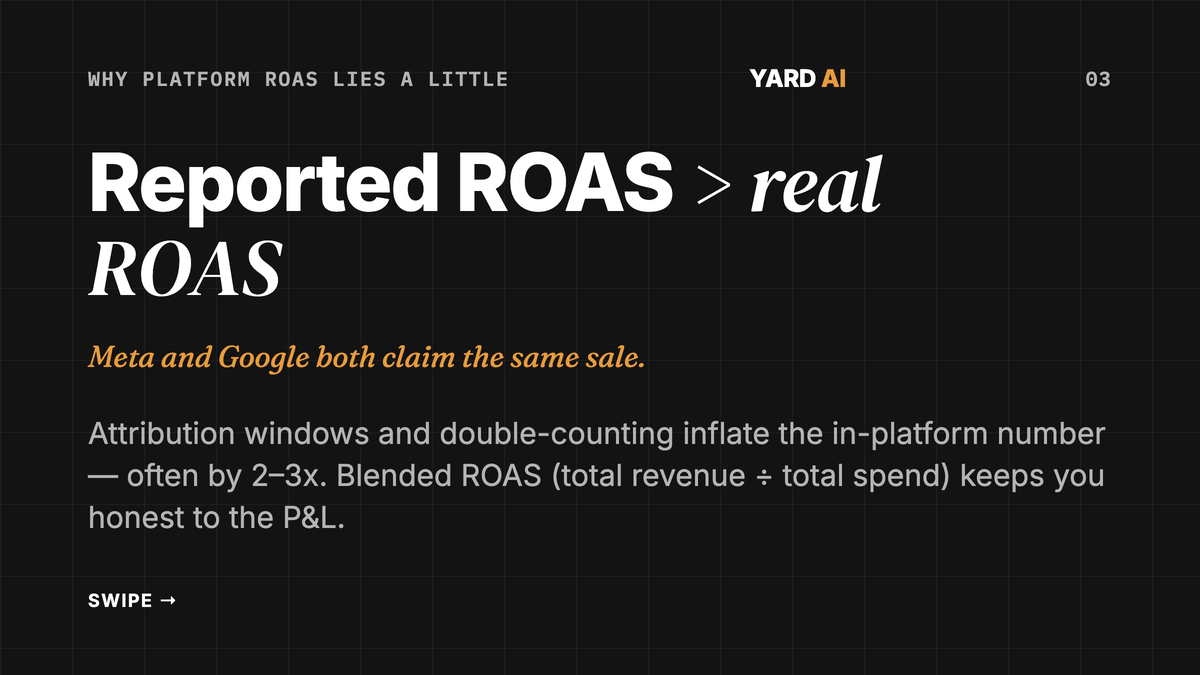
The ROAS inside Meta and Google is almost always rosier than reality. There are two reasons. First, attribution windows. A 7-day-click and 1-day-view setting lets a platform claim conversions it only loosely influenced. Second, double-counting. Meta and Google both take credit for the same sale. So summing in-platform numbers overstates real performance.
How big is the gap? Polar Analytics reports that platforms routinely over-report ROAS by 2–3x versus first-party click-based measurement. View-through conversions alone can double or triple Meta's reported number. The honest fix is blended ROAS. That is total revenue across all channels divided by total ad spend across all channels. It won't flatter any single platform. But it won't lie to your P&L either.
Which metric to use when
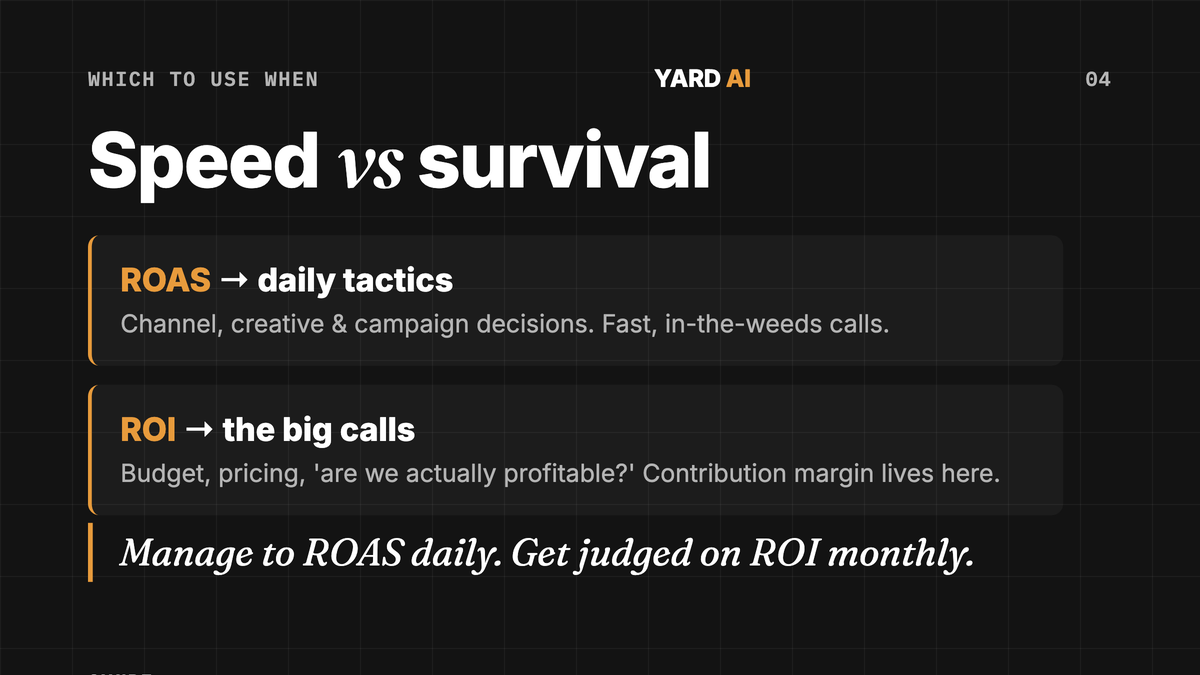
Use ROAS for speed and tactics. Compare creatives, pause losers, shift budget between campaigns within a channel. It is the right tool for daily, in-the-weeds decisions.
Use ROI and contribution margin for the big calls. That means total budget, pricing, discount depth, and the real question: are we making money? Manage to ROAS daily. Get judged on ROI monthly.
Closing CTA
ROAS isn't wrong. It is just incomplete. The brands that scale profitably pair it with a break-even target and a clear view of margin. If your campaigns look healthy but cash feels tight, the gap usually sits between these two metrics.
At YARD, we build media plans around break-even ROAS and real contribution margin, not vanity numbers. See how our performance marketing team runs full-funnel paid media on blended returns. If that's the math you want on your side, let's talk.
FAQ
What is the difference between ROAS and ROI?
ROAS measures revenue per rupee of ad spend. ROI measures actual profit after all costs. ROAS judges a channel. ROI judges the whole business.
Can you have a high ROAS and still lose money?
Yes. ROAS ignores COGS, shipping, returns, and fees. If those costs are high, a strong ROAS can still leave you at a loss.
What is break-even ROAS?
It is the ROAS where profit equals zero before overhead. The formula is 1 divided by your contribution margin. A 25% margin needs a 4x break-even ROAS.
Why is platform ROAS higher than my real ROAS?
Attribution windows and double-counting inflate it. Meta and Google often claim the same sale. Platforms can over-report ROAS by 2–3x versus first-party tracking.
What is blended ROAS?
It is total revenue across all channels divided by total ad spend across all channels. It removes platform overlap and maps closer to real profit.
Should I use ROAS or ROI to make decisions?
Use both. Use ROAS for daily tactical calls. Use ROI and contribution margin for budget, pricing, and profit decisions.
What is contribution margin?
It is revenue minus all variable costs, shown as a percentage. Variable costs include COGS, shipping, returns, and fees. It bridges ROAS and real profit.
Insights from Our Experts
Explore our latest articles on digital marketing strategies.