
This is one D2C client's story. A D2C food brand. Strong product, messy ad account. The team had a real catalog. They had real demand. They had a real Shopify funnel. What they did not have was a Google Ads structure that matched any of it.
In 90 days, monthly revenue moved from ₹5L to ₹19L. That is a 3.8x lift. Same product. Same site. New architecture. No new creative team. No celebrity endorser. Just six campaigns instead of two.
We rebuilt the account on YARD's 6-Campaign Google Ads Architecture. Below is the exact playbook. The exact bid strategies. The exact budget split. The exact week-by-week cadence. Read it and copy it. That is the point of a case study.
The Starting Point: A Mixed-Up Account
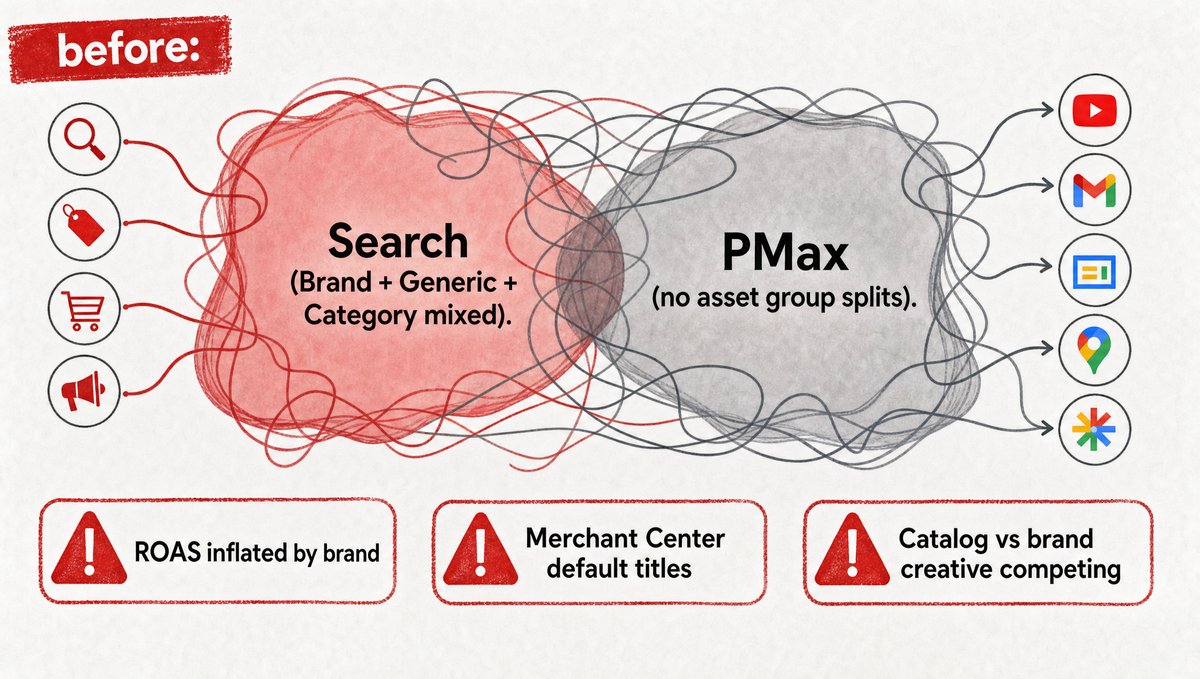
Before we touched it, the account had three problems. They compounded each other. Each one masked the next. Together, they made the account look healthy at a glance and broken under audit.
First, no separation. Brand and generic queries shared one campaign. Branded conversions inflated ROAS. Generic Search was actually losing money. Nobody could tell.
Second, Merchant Center was raw. Product titles were supplier defaults. Brand-name-leading. Keyword-irrelevant. Shopping match quality was poor.
Third, one underfed PMax. No asset-group splits. Catalog and brand creative competed for the same budget.
Performance Max already drives most of Google's retail growth. Google reported PMax adoption is now standard for retail advertisers (Source: Google Ads Blog, 2024 — blog.google). But it only works when the rest of the account is clean.
Q: Why fix structure before scaling spend?
A: Spend amplifies whatever you point it at. Bad signal scales bad outcomes. We saw 40% of "branded" conversions were actually category buyers. That's invisible at ₹5L. It's a six-figure miss at ₹19L.
The 6-Campaign Google Ads Architecture
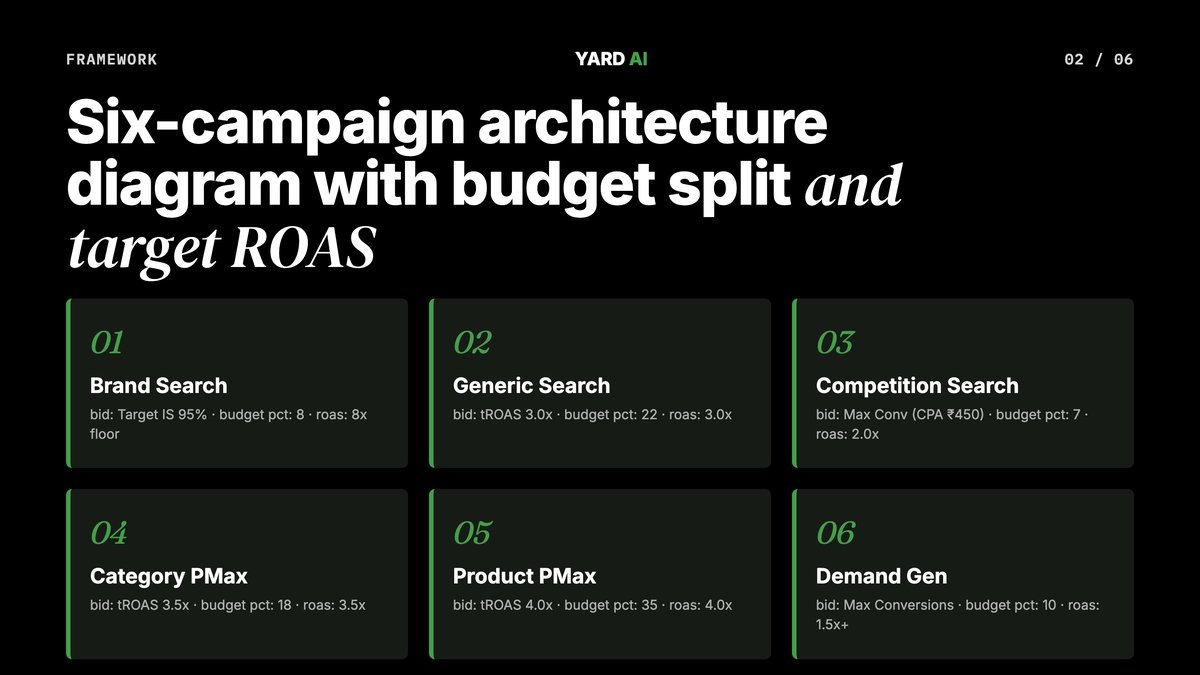
We replaced the old setup with six parallel campaigns. Each owns one intent layer. Each has its own bid strategy. Each has its own budget cap. None compete with each other for the same query. That is the whole point. Below is the exact spec we ran. Copy it onto a napkin if you need to.
Campaign 1 — Brand Search
- Type: Search
- Bid strategy: Target Impression Share (top of page, 95%).
- Budget share: 8%
- Target ROAS: floor 8x.
- Match types: exact only on brand terms.
- Job: catch existing demand cheap.
Campaign 2 — Generic Search
- Type: Search
- Bid strategy: Target ROAS 3.0x.
- Budget share: 22%
- Match types: phrase on category terms.
- Negatives: brand name blocked.
- Job: pull new buyers off high-intent queries.
Campaign 3 — Competition Search
- Type: Search
- Bid strategy: Maximize Conversions (capped CPA ₹450).
- Budget share: 7%
- Match types: exact + phrase on competitor brands.
- Job: steal share at high margin.
Campaign 4 — Category PMax
- Type: Performance Max
- Bid strategy: Target ROAS 3.5x.
- Budget share: 18%
- Asset groups: one per product category.
- Brand exclusion: ON
- Job: capture broad category demand.
Campaign 5 — Product PMax
- Type: Performance Max
- Bid strategy: Target ROAS 4.0x.
- Budget share: 35%
- Asset groups: one per hero SKU (10+ assets each).
- Job: scale conversions on product-aware buyers.
Campaign 6 — Demand Gen
- Type: Demand Gen
- Bid strategy: Maximize Conversions.
- Budget share: 10%
- Placements: YouTube + Discover + Gmail.
- Job: feed the funnel with new prospects.
Q: Why six campaigns and not three?
A: Each layer captures a different intent. Brand and Generic compete in different auctions. PMax can't tell them apart on its own. Six campaigns make signal legible. Legible signal lets you steer money with confidence.
Before vs After: The Campaign List
The old account ran two visible buckets. The new one runs six. The shift was not about more spend. It was about clearer signal. Same ad budget, split into six legible streams. Below is the full ledger so you can see what each campaign earned at the new ceiling.
Before (failing setup):
- 1 mixed-keyword Search campaign (brand + generic + category).
- 1 unsegmented PMax campaign.
- Total monthly revenue: ₹5L.
- Blended ROAS: 1.9x (inflated by branded clicks).
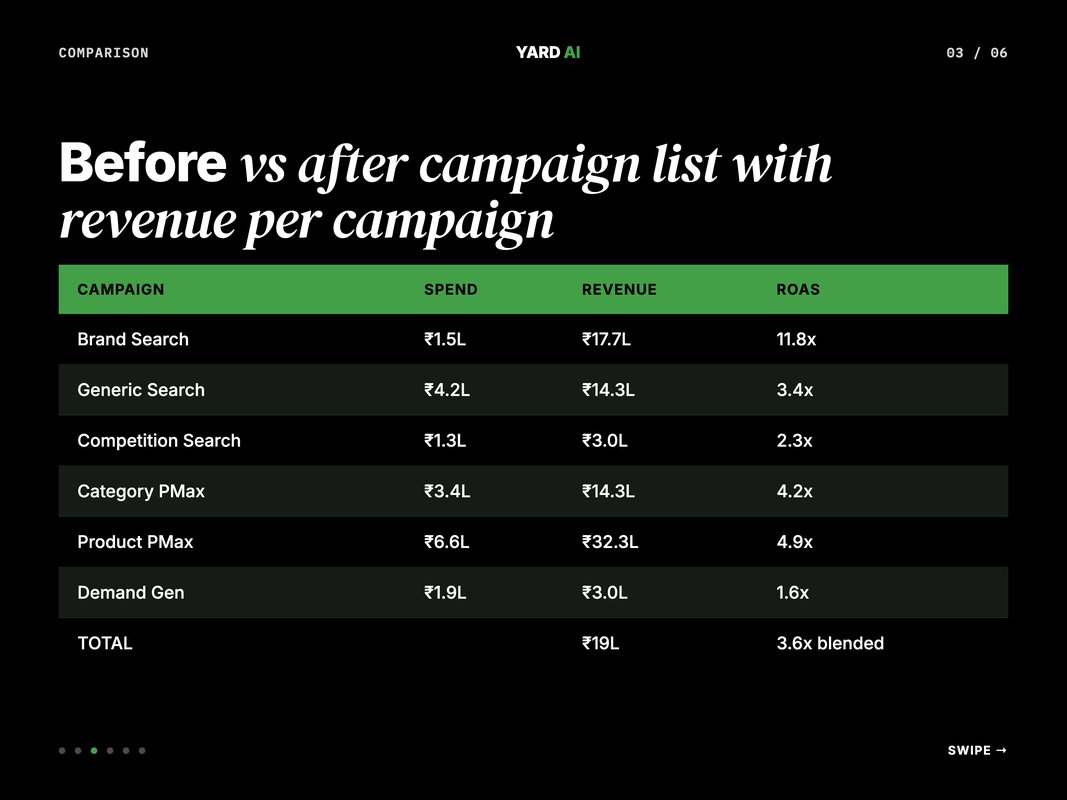
After (6-Campaign Architecture):
- Brand Search — ₹1.5L spend / ₹17.7L revenue / 11.8x ROAS.
- Generic Search — ₹4.2L spend / ₹14.3L / 3.4x.
- Competition Search — ₹1.3L / ₹3.0L / 2.3x.
- Category PMax — ₹3.4L / ₹14.3L / 4.2x.
- Product PMax — ₹6.6L / ₹32.3L / 4.9x.
- Demand Gen — ₹1.9L / ₹3.0L / 1.6x.
- Total monthly revenue: ₹19L.
- Blended ROAS: 3.6x (clean signal).
Quick Facts: scale result
- Monthly revenue moved from ₹5L to ₹19L. That's 3.8x in 90 days.
- Six parallel campaigns replaced two messy ones.
- Blended ROAS held at 3.6x across the ramp.
- Product PMax took the biggest budget share at 35%.
- Same architecture scaled a senior-care account by 2.75x — ₹15-20L to ₹55L/mo
Week-by-Week: How the 90 Days Ran
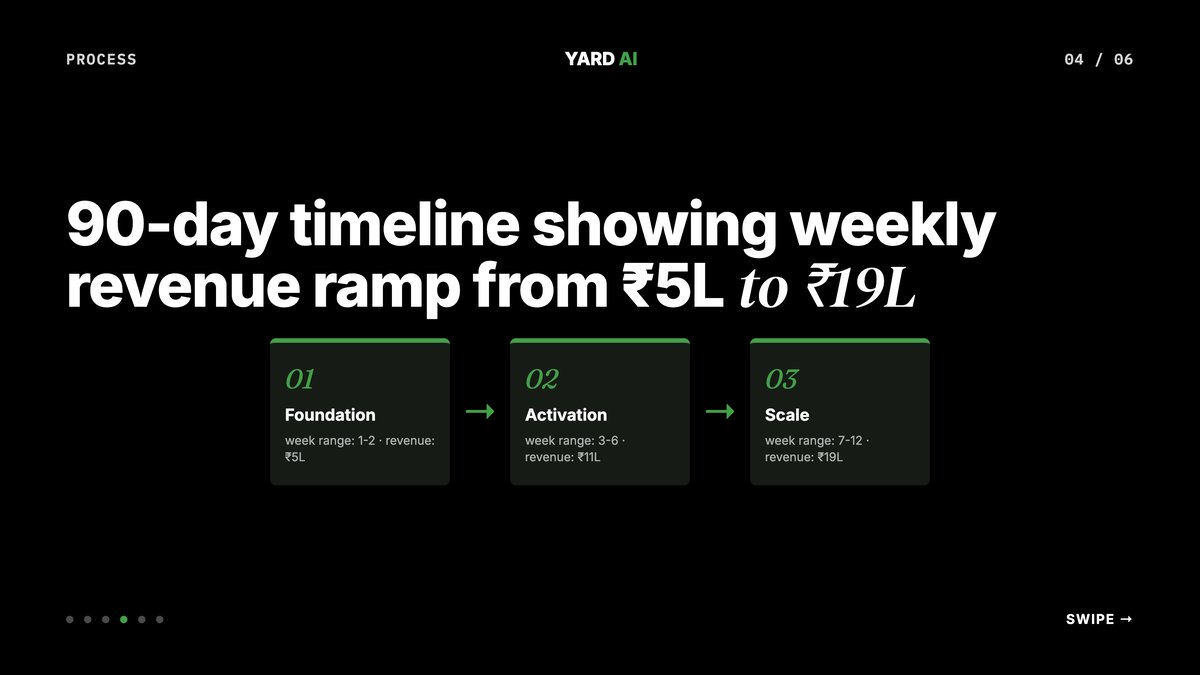
We split the build into three phases. Each phase had one job. Foundation was about plumbing. Activation was about turning every campaign on. Scale was about feeding budget to the winners and starving the losers. Below is the actual cadence, week by week.
Weeks 1-2 — Foundation
The first 14 days were plumbing. No scale yet.
- Rebuilt Merchant Center titles. New format: Product Type, Variant, Brand.
- Installed Enhanced Conversions on Shopify checkout. Validated user_data fields fired.
- Built negative-keyword lists per new campaign.
- Launched Brand Search and Generic Search at small budgets.
- Paused the legacy mixed campaign.
By end of Week 2, monthly run-rate sat at ₹5L. No lift yet. The structure was set.
Weeks 3-6 — Activation
This is where the lift starts.
- Week 3: launched Category PMax. Top 5 hero SKUs into Product PMax.
- Week 4: launched Competition Search on two competitor brands.
- Week 4: pulled first search terms report. Added 47 negatives.
- Week 5: Product PMax expanded to all 18 SKUs. Demand Gen launched on YouTube.
- Week 6: first clean ROAS read. Reallocated 30% out of Demand Gen into winners.
By end of Week 6, run-rate hit ~₹11L/mo. Halfway to target.
Weeks 7-12 — Scale
The last six weeks were budget allocation on the winners.
- Generic Search budget +40% week-over-week. ROAS held above 3x.
- Brand Search hit a volume ceiling at ₹1.5L/mo. Existing demand maxed.
- Added 12 new Product PMax asset groups. Sub-cluster splits.
- Added "gifting vs self-use" splits inside Category PMax.
- Final week: ₹19L/mo. Blended ROAS 3.6x.
Q: Why did Brand Search plateau?
A: You can't bid for demand that doesn't exist. Brand search volume is fixed. Once you own 95% impression share, the only way up is more brand awareness. That's the job of Demand Gen, not Brand Search.
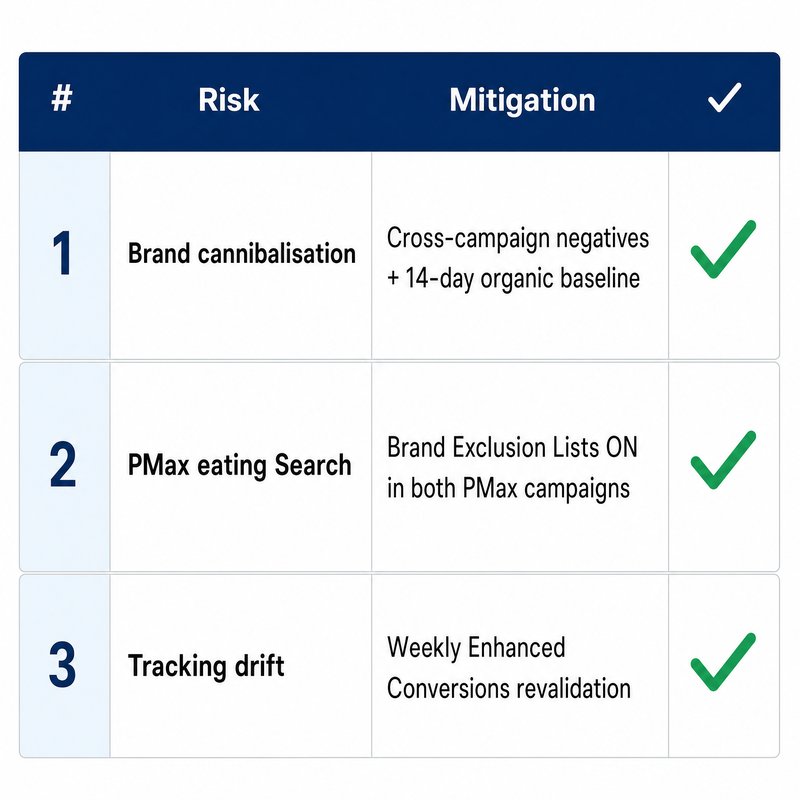
The Three Risks We Watched
Three things kill scale runs. We tracked all three weekly. Each one quietly inflates results in the short term. Each one breaks the model in the long term. Watch all three or stop reading and just keep pumping budget into PMax.
Risk 1: Brand cannibalisation. Generic ads can steal clicks from organic. We blocked brand terms in Generic. We blocked generic terms in Brand. We held a 14-day organic baseline. Incremental lift was clean.
Risk 2: PMax eating Search. PMax loves brand queries if you let it. We turned on Brand Exclusion Lists in both PMax campaigns. PMax could never compete with Brand Search.
Risk 3: Tracking drift. Even a 5% gap in tracking distorts decisions at scale. Twice during the 90 days, GTM changes broke user_data fields. We caught both inside 24 hours via the Conversions diagnostic report. Studies of paid media find tracking gaps as a top scale-killer (Source: Search Engine Land, 2024 — searchengineland.com).
The accounts that fail to scale fail on Risk 3. Tracking integrity is the floor everything else stands on.
We also watched two daily metrics. Search impression share by campaign. New-customer rate from Demand Gen. Both are leading indicators. Both move before ROAS does. If new-customer rate drops, your funnel is starving. If brand impression share dips below 90%, a competitor is bidding harder. Catch both inside 48 hours, not 14 days.
Why This Pattern Repeats at the Next Tier
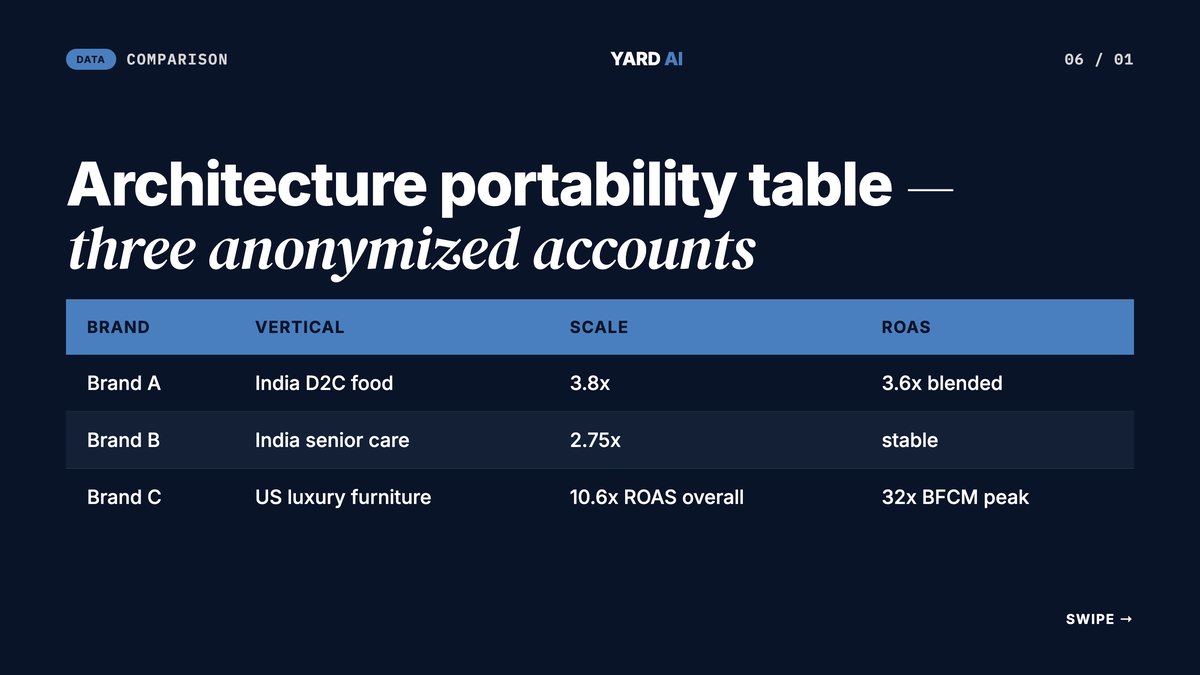
This is not a one-off. The same architecture scaled a sister account in senior care. From ₹15-20L/mo to ₹55L/mo. That is 2.75x with stable ROI. Same six campaigns, bigger spend tier. Different category, different buyer, same scaffolding.
It works because Google Ads becomes a budget problem once structure is right. You see what each layer earns. You shift money to winners. You hold the floor (Brand) while you push the ceiling (Generic + PMax).
According to Google's own retail data, advertisers using PMax with structured asset groups see meaningful conversion lift over single-campaign setups (Source: Google Ads Blog, 2024 — blog.google). Research from Search Engine Land shows account structure is the lever for scale past ₹10L/mo (Source: Search Engine Land, 2025 — searchengineland.com). Creative is not the bottleneck.
A US luxury account ran the same DNA in furniture. Different vertical. Same playbook spine. Proof the architecture is not India-only. The math holds across price points. The math holds across countries. Clean separation makes signal legible. Legible signal scales. That is the rule.
See Our Work
YARD runs Performance Marketing across multiple brand accounts. We manage $12M in ad spend at
The brand scaled 3.8x on this exact 6-Campaign Architecture. A senior-care account scaled 2.75x on the same one. A US luxury account ran it for US luxury. The playbook is portable.
We don't pitch decks. We ship audits.
If your Google Ads account is stuck at the same revenue ceiling each month, the issue is almost always structure. Creative refreshes won't fix a mixed-keyword Search campaign. New ads can't unwind a black-box PMax. Architecture comes first.
Review our proof. Look at the campaign breakdowns above. Then look at your own account. If you see brand and generic in one campaign, you know the first move.
YARD audits accounts against this exact pattern. We ship a 90-day scale plan in five days. No retainer needed for the audit. We hand you the report and you decide what to do with it.
The audit is not a sales call. It is a structural read of your account. Where is brand cannibalising generic? Where is PMax double-bidding on branded queries? Where is tracking quietly drifting? Where is your hidden ₹3-5L of monthly waste? Those are the questions we answer in five days.
See our case studies and proof of work at https://yardagency.ai. Bring your account. We will show you where the budget is leaking.
The Bottom Line
₹5L to ₹19L in 90 days came from one decision. Stop running two campaigns. Start running six. That is the headline. The rest is execution.
Structure made signal legible. Legible signal made budget allocation obvious. Obvious allocation scaled. The rule is simple. The work is not. But the rule is simple.
Run Google Ads at ₹3L+ per month? Brand and generic in one campaign? This is the highest-ROI single change this quarter.
The decision is not "spend more." It is "spend cleaner." Most accounts have plenty of budget. They lack the structure to point that budget at the right intent layer. Six campaigns fix that. You stop guessing which line item earned which sale. You start steering with intent. That is the whole game.
FAQ
Q: What was the starting point?
A: ₹5L per month in revenue. The setup ran broad-keyword Search and one underfed PMax. ROAS was inconsistent. There was no separation between brand and generic traffic.
Q: What is YARD's 6-Campaign Google Ads Architecture?
A: Six parallel campaigns. Brand Search, Generic Search, Competition Search, Category PMax, Product PMax, and Demand Gen. Each owns one intent layer of the funnel.
Q: How long did the scale take?
A: Three months. ₹5L to ₹19L/mo. That's 3.8x revenue growth. Most of it came from structure plus Merchant Center work in the first 30 days.
Q: Did ROAS hold during the scale?
A: Yes. Blended ROAS held at about 3.6x through the ramp. The architecture isolates each layer. We could see and steer each campaign without drift. the senior-care account held the same way at 2.75x scale.
Q: Will this work for any D2C brand?
A: It works best at ₹3L-25L/mo spend with at least 8 SKUs and a feed-driven catalog. Below that, six campaigns is overkill. Above that, the architecture compounds. The senior-care account scaled to ₹55L/mo on the same playbook.
Insights from Our Experts
Explore our latest articles on digital marketing strategies.